1. Introduction
The rapid growth of the world population has led to a significant increase in the demand for fossil fuels (Debnath et al., 2021). In 2018, approximately 14,000 Mt of energy was consumed globally, and demand is projected to increase by approximately 50% by 2050 (Jiao et al., 2024). About 80% of global energy demand is supplied by burning fossil fuels, such as gas, coal, and oil (Montalvo et al., 2023). This dependence on fossil fuels causes climate change and environmental damage, highlighting the need for clean, renewable, and sustainable energy alternatives.
A sustainable solution to environmental pollution and the energy crisis is cultivating microalgae with industrial effluents, promoting growth while valorizing waste. Currently, microalgae are being studied as a low-cost raw material, and their a positive environmental impact. They are used in wastewater treatment (Nguyen et al., 2019) because they effectively remove nutrients, metals, pathogens, and other contaminants (Esteves et al., 2024). Microalgae use photosynthesis to capture CO2 and store energy in lipids and carbohydrates, which can be converted into biodiesel and ethanol (Li et al., 2019). Furthermore, their high productivity makes them a natural source of various valuable compounds, including proteins, carotenoids, and pigments, which have applications in multiple industries, such as food, fertilizers, pharmaceuticals, cosmetics, and the energy sector (Amaral et al., 2023).
Chlorella vulgaris is a unicellular, spherical, green microalga that belongs to the group of eukaryotes and widely distributed green microalga in natural aquatic systems and is gaining interest in the valorization of wastewater (Yu et al., 2024). It rich composition of lipids, carbohydrates, vitamins, proteins, nucleic acids, minerals, β-carotenes, chlorophyll-a and -b, lutein, tocopherol, ascorbic acid, retinol, riboflavin, and antioxidants (Ekeuku et al., 2024; Van Nerom et al., 2024) makes it suitable for applications in nutrition, cosmetics, animal feed, agriculture, and pharmaceuticals. Chlorella vulgaris growth and its compound production are influenced by culture parameters such as nutrient availability, culture medium, residence time, light intensity, pH, photoperiod, and temperature (George et al., 2014). The light supplied affects growth, metabolism, and compound accumulation (Bazdar et al., 2018; George et al., 2014), because light is the main energy source for the photosynthesis process (Li et al., 2019), while pH regulates the enzymatic activity and improves the solubility of minerals affecting cellular metabolism and biomass composition (Cantú et al., 2024). Whey concentration provides essential nutrients for the efficient development of microalgae. Optimizing these factors is crucial for enhancing lipid and carbohydrate accumulation.
The accumulated carbohydrates in the microalga can be converted into bioethanol (Bibi et al., 2021; Monjed et al., 2021), butanol and hydrogen (De Farias Silva et al., 2020), or biogas (Alharbi, 2024), while, lipids are used for biodiesel production (Oliva et al., 2024; Sanjurjo et al., 2024). Furthermore, the combined study of lipid and carbohydrate accumulation helps understand microalgae´s biochemical pathways under different culture conditions.
The dairy industry contributes significantly to environmental pollution due to the large volumes of high-organic effluent, primarily whey. According to Athanasiadou et al. (2023), around 11 million tons of whey are produced yearly worldwide, and it is estimated that global milk production for the year 2030 will grow to 1060 million tons. Considering that 30% of the world’s milk is used for cheese production, it is possible to calculate the whey generated from the cheese-making process, which will be around 3180 Mt in 2031 (Ozcelik et al., 2024). Whey is defined as the liquid fraction that remains after coagulation and removal of casein during cheese production. Whey retains about 55% of the total nutrients in milk, among which lactose, soluble proteins, fats, minerals, salts, and vitamins such as B12 stand out (Montalvo-Salinas et al., 2018). Due to its high organic load, the whey generates approximately 30 to 50g BOD (Biochemical Oxygen Demand) and 60 to 80g COD (Chemical Oxygen Demand) for each liter (Montalvo-Salinas & Cantú-Lozano, 2018). Consequently, untreated whey disposal in natural ecosystems can lead to several adverse effects, including soil impermeabilization and the eutrophication of aquatic systems, disrupting ecological balance (De Almeida et al., 2022). Therefore, treating whey is crucial to reduce environmental impacts and ensure ecosystem sustainability. Using Chlorella vulgaris for whey valorization is a promising alternative, as it contains the nutrients needed for its growth.
This study aims to evaluate the impact of light intensity, whey concentration, and pH on Chlorella vulgaris biomass production and its lipid and carbohydrate content for biofuel production. It offers a solution for disposing of industrial effluents like whey, utilizing Chlorella vulgaris' potential to exploit whey as a nutrient source efficiently.
2. Methodology
2.1 Photobioreactors
The laboratory-scale airlift photobioreactor (PBR) used for the cultivation of Chlorella vulgaris is shown in Figure 1. The PBR has an effective working volume of 2.5 L and was artificially illuminated with 12-watt LED lamps for 24 h. The PBR was completely covered to avoid any external lighting other than that provided by the LED lamps. The light intensity provided to the PBRs was measured using a digital luxmeter LX model 1330B. Agitation was performed by aeration using Elite 800 model air pumps with a power of 4.5 watts and an airflow of 90 L·h-1. All experiments were carried out at room temperature and atmospheric pressure.
2.2 Microorganisms, culture media, and experi-mental conditions
Microalgae cells were observed under the Velab Clinical Model VE-B6 optical microscope (China) using a 40x objective. Chlorella vulgaris cells (in the exponential growth phase) were separately inoculated into 15 PBRs with 2.5 L. The microalgae strain Chlorella vulgaris was cultivated mixotrophically in a Zarrouk medium with whey under different cultivation conditions. Whey samples were provided by the nutriCious H&D food factory, located in Acayucan City, Veracruz, southeast Mexico. Whey was obtained from a fresh pasteurized cheese-making process and used as the carbon organic source in the bioreactor. The study treatments were carried out according to the response surface Box-Behnken experimental design. In each experimental study, the initial biomass concentration on a dry basis was 0.051 g‧L-1. The independent variables manipulated in the experimental design were light intensity (25, 50, and 75 lumens), whey concentration (10, 20, and 30 mL) used as substrate, and pH (7.1, 8.6, and 10.1). The final biomass, lipids, and carbohydrate concentrations were measured as response variables. The levels of experimental design (natural and coded variables) used are shown in Table 1.
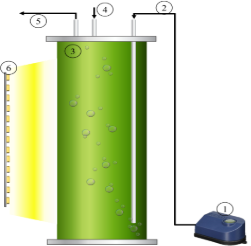
Figure 1. Experimental setup for microalga Chlorella vulgaris biomass production. 1) Air pump, 2) air inlet, 3) PBR, 4) sampling point, 5) air outlet, and 6) LED lamps.
2.3 Analytical methods
The whey samples were characterized by measuring pH, fats, non-fat solids, moisture, density, nitrogen total Kjeldahl, proteins, lactose, and freezing point, using a milk analyzer chemical composition, Lactoscan model. The percentage of titrable acidity (lactic acid %) was determined using the AOAC 16.023 standard (AOAC, 1980). The salt content was related to the percentage of non-fat solids using Equation 1, where NFS is the percentage of non-fat solids.
 (1)
(1)
pH of the growth medium was adjusted by adding 0.2 M K2HPO4 or 1 M NaOH using an Apera potentiometer model PH700. A daily 10 mL microalgal solutions were sampled via the sampling point, to measure its growth through time. For this purpose, the microalgae suspension was centrifuged at 4000 rpm for 10 minutes, then the supernatant was removed. The final cell biomass culture of Chlorella vulgaris (about two liters of microalgal suspensions) was harvested by flocculation by adding 1 g·L-1 of Al₂(SO4)3, the continuous medium was discarded. The harvested biomass was oven-dried at 100 °C for 6 h. Finally, the biomass (both the biomass at the sampling point and the final biomass) was quantified by dry weight in analytical balance.
2.3.1 Extraction of total lipids
Determining total lipids from dry biomass was carried out using the methodology proposed by Bligh & Dyer (1959). In brief, the dry biomass was ground into a fine powder: 1 g microalgae power was blended with 3 mL chloroform/methanol at a 2:1 ratio. The resulting mixture was agitated vigorously at room temperature. The solvent phase was recovered by centrifugation at 2000 rpm for 10 min. The pellet was re-extracted in 3 mL chloroform/methanol solution twice. The resulting extract was evaporated at 40 °C and dried at 70 °C for 2 h. It was subsequently weighed after cooling to room temperature. The lipids content was calculated using Equation 2.
 (2)
(2)
where wf is the final weight of the tube with lipids, wi is the initial weight of the tube without lipids, and biomass is the dry weight of the biomass used.
2.3.2 Carbohydrates determination
The total carbohydrates were measured using the protocol developed by Dubois et al. (1956). Briefly, 1 g of dry biomass was digested in 3 mL of H2SO4 (1.5% v/v) at 121 °C and 15 psi for 15 minutes. The digestate was diluted with 2 mL of distilled water. 2 mL of the final digestate solution was mixed with 2 mL of 5% (w/v) phenol solutions and 3 mL of 95% H2SO4. The total carbohydrates in the suspensions were determined by the light absorption at 480 nm using a glucose calibration curve.
2.4. Kinetic modeling
A sigmoidal-type model was fitted to the experimental growth data. The adjusted kinetic model was modified Gompertz (Equation 3), where X is the biomass concentration at time t, X0 is the initial biomass concentration, µmax is the specific growth rate, and λ is the lag phase. The model’s goodness of fit was calculated by root mean square error (RMSE) (Equation 4) and coefficient of determination (R2). The double time (td), which indicates the generation time, was calculated using Equation 5.
 (3)
(3)
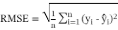 (4)
(4)
 (5)
(5)
2.5 Statistical analysis
The experimental biomass, lipids, and carbohy-drates data obtained from the Box-Behnken design were statistically analyzed. Statistical analysis was performed using the Minitab 21.2 software. Each treatment was analyzed in triplicate calculating the mean and standard deviation.
3. Results and discussion
3.1 Whey characterization
Whey is a by-product of the dairy industry, particularly cheese production. It is widely studied for its potential in food, bioenergy, and agro-industrial waste management applications. Therefore, its characterization is key to its utilization. Table 2 provides a detailed view of the composition of the whey used. The pH value is typical of sweet whey, which is slightly acidic, confirming its origin from the enzymatic coagulation of casein. Zero fat content indicates that the whey has been efficiently filtered. From an application perspective, the absence of fat improves the fluidity and reduces the viscosity of the whey, facilitating its use as a substrate. The 7.27% non-fat solids value reflects a significant proportion of components such as proteins, lactose, salts, and other non-fat substances. This value suggests that whey can be used in the food industry for the production of protein concentrates, protein isolates, lactose, or fortified beverages. In the area of bioenergy, non-fat solids provide important nutrients that favor microbial growth. The density found is within the expected range, which usually varies between 1.025 and 1.035 g·cm-³. The protein concentration (2.68%) is mainly due to lactalbumin and lactoglobulin. The nitrogen content (0.42%) is mainly related to whey proteins since these represent the largest source of nitrogen in the dairy matrix. In energy applications, the nitrogen content in agro-industrial waste is important to maintain an adequate carbon-nitrogen balance for the development and microorganism production. Lactose is the main carbohydrate and its value is within the expected range, given that sweet whey typically has between 3.8% and 5% lactose. The salt content (0.60%) includes minerals such as sodium, potassium, calcium and magnesium. This salt content plays a key role in protein stability and organoleptic characteristics of whey. The freezing point of whey is influenced by the concentration of solutes, in particular lactose and salts. This value is consistent with data reported in the literature, indicating that the whey has not been diluted (Montalvo-Salinas & Cantú-Lozano, 2018; Rodríguez-González et al., 2024).
Table 2
Physicochemical characterization of whey (n = 3)
Parameters | Value |
pH [-] | 5.66±0.345 |
Fats [%] | 0.00±0.000 |
No-fats solids [%] | 7.27±0.173 |
Moisture [%] | 92.5±0.172 |
Density [g/cm3] | 1.03±0.000 |
Proteins [%] | 2.68±0.061 |
Nitrogen total Kjeldahl [%] | 0.42±0.009 |
Lactose [%] | 4.02±0.097 |
Salts [%] | 0.60±0.014 |
Titratable acidity [%] (Lactic acid %) | 0.28±0.002 |
Freezing point [°C] | -0.44±0.010 |
3.2 Morphology of the microalga Chlorella vulgaris
The microalgae cells were observed in the optical microscope with a 40x objective. Figure 2 shows the Chlorella vulgaris microalga. The spherical morphological form of microalgae, and it can be observed that it does not have limbs that allow mobility in the culture medium. The figure shows a unicellular green alga that forms aggregates; sometimes, its cells are isolated. According to Coronado-Reyes et al. (2022), Chlorella vulgaris is a microalgae that presents an isolated or colony organization with a maximum of up to 64 cells. It has a structure similar to that of higher plants, as it contains a cell wall, mitochondria, and chloroplasts necessary for photosynthesis. The amount of chlorophyll and pigments in the cells allows them to be seen alive and with their cell wall intact under the microscope. When cells are damaged or dead, the cell wall shows signs of deterioration, and the internal color of the microalgae turns dark green.
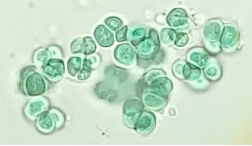
Figure 2. Microscopic morphology of Chlorella vulgaris microalgae (40x).
3.3 Chlorella vulgaris biomass production
Cultivating the microalga Chlorella vulgaris under different requirements is essential to studying how the microalga responds under various environ-mental conditions while optimizing its growth and the production of valuable compounds such as lipids and carbohydrates. On the other hand, mixotrophic cultivation is an attractive way to increase algal biomass concentration since it promotes the use of both inorganic and organic carbon sources. Figure 3 shows microalga growth in different experimental treatments using both inorganic and organic carbon sources (mixotrophic conditions). It can be seen that the greatest development of the microalga Chlorella vulgaris was obtained in treatments with high levels of intensity light and pH, reaching a maximum biomass production of 2.17 g·L-1. This produced biomass was greater than the 1.60 g·L-1 of Chlorella vulgaris biomass achieved by Melo et al. (2018) using whey as a substrate. On the other hand, Rautenberger et al. (2024), using BG11 as a culture medium, showed that C. vulgaris grown under mixotrophic conditions grew 5.54 and 6.75 times more than under phototrophic and heterotrophic conditions, respectively, reaching a biomass of 0.839 g·L-1 on a dry basis. However, the higher production achieved in this research may be due to continuous lighting. This condition can affect biomass growth due to the diurnal cycle of light and darkness (Alazaiza et al., 2023). This result highlights the synergistic effect of combining light intensity and the carbon source in mixotrophic cultivation to enhance biomass production, a factor that could play a crucial role in optimizing sustainable methods for producing biofuel precursors.
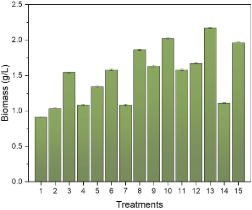
Figure 3. Growth of Chlorella vulgaris under different light intensities, whey concentrations, and pH conditions.
The data from dry biomass reached was statistically analyzed using the Minitab 21.2 software. Figure 4a shows the influence of each factor evaluated and their interactions, estimated in descending order of significance, with a 95% confidence level, on biomass growth. The bars of light intensity and pH extend beyond the vertical red line, indicating that these factors significantly impact biomass growth. They are reaching a higher cell density at the highest light intensity levels. Microalgae growth is influenced by light intensity. Light is necessary for microalgae growth and is the most important element for photosynthetic activity. It contributes to cell proliferation, respiration, and photosynthesis. Microalga needs light to produce ATP and NADPH and to synthesize molecules necessary for growth (Ma & Jian, 2023). Alharbi et al. (2024) concluded that higher light intensity increases growth biomass in microalga until the photo-inhibitory threshold is reached. However, this effect and the threshold limit are species-specific. On the other hand, Esteves et al. (2024) and Chojnacka & Noworyta (2004) mentioned that light plays an important role in the cultivation of photosynthetic microorganisms, decreasing growth at low levels of illumination (photo-limitation) and at levels that are too high (photo-inhibition; this effect is caused by the photo-oxidation reaction inside the cell as the excess light cant no be absorbed into de photosynthetic apparatus), with an interval between two extremes (light-saturation) and light-dependent growth.
The effect of pH on microalga growth is due to the influences on the solubility of minerals, affecting cellular metabolism and biomass composition. Josephine et al. (2022) mentioned that an alkaline pH between 8 and 9 favors high growth and biomass production in microalgae. Andrade & Costa (2007), reported that alkaline pH values produce greater photosynthetic activity due to the pH influences many biochemical processes associated with the growth and metabolism of microalgae, including the ionization of biochemical metabolites, solubility, and bioavailability of nutrients. On the other hand, Khalil et al. (2010), reported that the microalga Chlorella grows in a wide pH range, from 4-10.
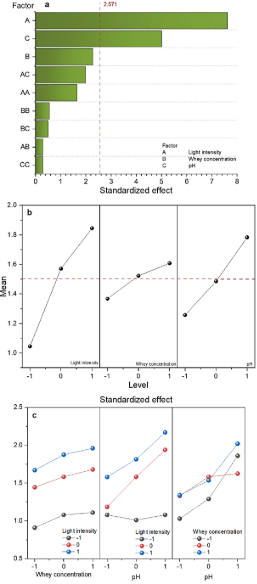
Figure 4. a) Pareto chart: Standardized effects on Chlorella vulgaris growth under light intensity, whey concentration, and pH variations, b) Main effects graph on Chlorella vulgaris growth, c) Interaction graph on Chlorella vulgaris growth.
The main effects plot describes how individual factors affect the response variable. Figure 4b shows the main effects of biomass growth. The factors of light intensity and pH show a steep slope, indicating that these factors have a significant positive effect, suggesting that as the level of these factors increases, the biomass also increases. The whey concentration did not significantly affect biomass growth in the interval studied; however, the highest biomass growth was obtained when the highest level of this factor was used.
From the interaction graph, we can interpret the presence or absence of a relation between factors. Parallel lines indicate no interaction; the effects of the factors are additive. Positive interaction (synergistic) occurs when the combination of factors amplifies the effect; negative interaction occurs when it reduces the effect. Strong interaction is shown by crossing lines, where the impact of one factor depends heavily on the other's level. Weak interaction appears as slightly non-parallel lines, with minimal effect changes. Non-parallel lines (crossing or diverging) confirm the interaction, meaning factor effects depend on each other and cannot be considered independently. Figure 4c shows that whey concentration and pH do not significantly influence how light intensity affects the microalga growth. In the figure, it can be observed that the interaction lines of pH and whey concentration cross, suggesting that the effect of whey concentration on microalgae growth depends on the pH of the medium. This interaction is due to the whey providing essential nutrients, while an adequate pH ensures that the nutrients are accessible and that metabolic conditions are optimal for growth.
3.4 Biomass growth modeling
Fitting a kinetic model, like the modified Gompertz, helps predict and describe Chlorella vulgaris growth trends and specific growth rates under varying environmental conditions. Table 3 presents the goodness of fit of models to the experimental data of each run. The modified Gompertz model adequately fit the experimental data since it presented a Radj2 in an interval of 0.90 < Radj2< 0.98. The model’s validity is verified by presenting low root mean square error (RMSE) values between the predicted and observed values (0.58 < RMSE< 1.47). In Table 3, it can be seen that the specific growth rate increased with increasing light intensity and whey concentration due to the greater absorption and utilization of light by Chlorella vulgaris, and the availability of the carbon source.
On the other hand, the best results found for the specific growth rate were intermediate pH levels (8.60). This agrees with what was reported by Josephine et al. (2022). Specific growth rate (µmax) values have been reported for Chlorella vulgaris in the interval of 0.4-0.7 d-1(Ararat et al., 2020; Forero-Cujiño et al., 2016). The values found for the specific growth rate of the microalga Chlorella vulgaris are within the range of values reported in the literature. Low µmax values indicate slow growth and lower nutrient consumption but also mean more time for stable growth.
In contrast, high µmax values indicate rapid microalgae growth and increased nutrient consumption. The divergence between µmax among runs is due to the different culture conditions. The doubling time reflects the growth capacity of a microalgae population under the study conditions. In comparison, treatment 15 presented the highest µmax (1.337 d-1) and a shorter doubling time (0.376 d), which explains the productive capacity of the system in a short time.
Table 3
Goodness of fit of models to the experimental data of each treatment
Treat- ment | µmax (d-1) | λ (d) | td (d) | R2 | RMSE |
1 | 0.487 | 0.165 | 1.423 | 0.981 | 0.580 |
2 | 0.446 | 0.141 | 1.553 | 0.968 | 0.637 |
3 | 0.969 | 0.271 | 0.715 | 0.977 | 1.402 |
4 | 0.438 | 0.137 | 1.582 | 0.936 | 0.674 |
5 | 0.584 | 0.182 | 1.187 | 0.917 | 0.837 |
6 | 0.976 | 0.277 | 0.710 | 0.959 | 1.346 |
7 | 0.461 | 0.145 | 1.503 | 0.941 | 0.690 |
8 | 0.967 | 0.274 | 0.716 | 0.972 | 1.346 |
9 | 0.884 | 0.251 | 0.784 | 0.959 | 1.288 |
10 | 0.752 | 0.205 | 0.922 | 0.972 | 1.368 |
11 | 0.714 | 0.212 | 0.971 | 0.972 | 1.040 |
12 | 0.681 | 0.198 | 1.018 | 0.931 | 1.081 |
13 | 0.673 | 0.179 | 1.030 | 0.960 | 1.404 |
14 | 0.494 | 0.154 | 1.403 | 0.985 | 0.736 |
15 | 1.337 | 0.376 | 0.518 | 0.908 | 1.471 |
Figure 5 shows the fit of the modified Gompertz model to the experimental data of treatment 13 (treatment with higher biomass production). Equation 6 is the mathematical model fitted to experimental data.
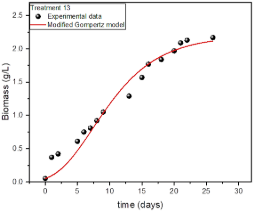
Figure 5. Fitting the modified Gompertz model to the growth of Chlorella Vulgaris in treatment 13.
 (6)
(6)
The fit of the kinetic model to the experimental growth data of Chlorella vulgaris for the different treatments is presented in the Supplementary Material (Figures S1-S14).
Lipids and carbohydrates in Chlorella vulgaris store energy, aiding survival under variable conditions and serving as key biofuel resources. Sections 3.5 and 3.6 examine light intensity, whey concentration, and pH effects on their accumulation.
3.5 Lipid accumulation
The analysis of lipid production in microalgae is important due to its potential to provide sustainable solutions in the fields of energy (Soleimani Khorramdashti et al., 2021), nutrition (Koochi et al., 2023), and reduction of environmental impact (Najar-Almanzor et al., 2024; Rajivgandhi et al., 2022). Figure 6 presents the lipid production for the different treatments. It can be observed that the highest yields were achieved in treatments 11, 13, and 15, reaching a concentration of 83 mglipid·gbiomass-1, 88 mglipid·gbiomass-1, and 82 mglipid·gbiomass-1. The lipid concentration in these treatments corresponds to 8.3%, 8.8%, and 8.2% of the dry biomass, respectively. Compared with other research works, this produced lipid was greater than the 8.1 mglipid·L-1 culture, corresponding to 0.31% of the biomass of Chlorella vulgaris achieved by Ardila-Álvarez et al. (2017), in a culture medium that uses sodium acetate as a carbon source. Wong et al. (2017) maximized the biomass and lipid production in Chlorella vulgaris, reaching a biomass production of 72.083 mg·L-1 and a lipid concentration of 287 mg·L-1. These authors concluded that nitrogen and phosphorus deprivation in the culture medium affects the accumulation of lipids and the lipid composition in the microalga Chlorella vulgaris. Zhang et al. (2014) produced 114 mglipid·L-1 using a BG11 culture medium with 30 g·L-1 of glucose under mixed photoautotrophic conditions with yeast. These authors concluded that a mixed culture containing yeast under photoautotrophic conditions is more beneficial for the growth of microorganisms than other cultures. Faruquel et al. (2025), using hypersaline brine (HBS) as a culture medium, achieved a lipid content of 30.94% by weight of dry biomass of Chlorella sorokiniana when using 60% HBS. The authors concluded that this lipid accumulation is due to salt stress, since excessive levels of salinity induce a state of stress in cells, diverting their energy towards lipid synthesis as an adaptation mechanism.
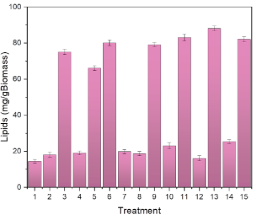
Figure 6. Lipid accumulation on Chlorella vulgaris. Intensity light, whey concentration, and pH effect.
Figure 7a that light intensity and whey concentration significantly impact lipid accumulation. It can also be seen that the whey concentration factor has a quadratic effect (BB). Figure 7b reveals the statistical analysis of the main effects, where the following can be observed: I) The lipid production was proportional to the light intensity. According to Nguyen et al. (2019), increasing the proportion of lipids is remarkably observed when there is an increment of light intensity in microalgae culture. This increase in lipids with increasing light intensity can be attributed to i) photosynthesis is favored by irradiance, which promotes the conversion of nutrients into lipids. ii) lipid synthesis is coordinated with the synthesis of carotenoids, which are subsequently esterified and stored as lipids in the cytoplasm. These carotenoids are produced at high light intensities to prevent photo-oxidative damage (Martínez Macias et al., 2017). iii) Increased light intensity can be considered a stress factor, as high luminosity generates an imbalance in the oxidation-reduction potential, with an accumulation of reducing power. Hydrogen ions must be transferred to reserve organic compounds, such as lipids, which increases the lipid composition necessary to restore the photosynthetic balance. Under light stress conditions, microalgae direct carbon assimilation towards synthesizing neutral lipids due to the need to increase their lipid content to recover photosynthetic efficiency (George et al., 2014). II) Increasing whey concentration increases organic carbon availability, enhancing photosynthetic activity and promoting the conversion of nutrients to lipids up to a certain intermediate substrate concentration level. III) The quadratic effect of the whey concentration factor is confirmed. In other words, there is a non-linear but rather curvilinear relationship between the whey concentration and lipid production. The curvilinear relationship can be explained as a non-proportional relationship between the factor and the response, i.e., initially increasing the whey concentration increases lipid production. However, from the medium level, continuing to increase the whey concentration decreases lipid production. IV) The pH did not significantly affect lipid production in the range studied concerning the average obtained as a response. However, it is important to mention that pH affects microalgae metabolism, including lipid synthesis. It has been observed that a pH outside the optimal range can induce stress in microalgae, which can lead to lipid accumulation. This phenomenon is part of the microalgae response to stress, where lipids, especially triacyl glycerides (TAGs), accumulate as a form of energy storage. The above may be because pH affects the solubility and availability of nutrients in the culture medium. This may indirectly influence lipid production, as the availability of essential nutrients is crucial for microalgae metabolism.
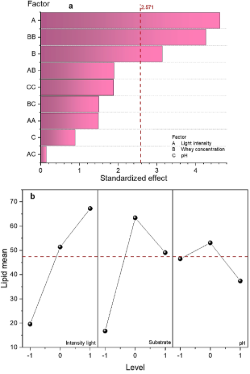
Figure 7. a) Pareto chart: Standardized effects on lipid accumulation under variations in light intensity, whey concentration, and pH. b) main effects graph on lipid production.
Contour plots show the dependence of lipid production on two main factors. From these graphs, we can interpret the following: I) Relationship between these variables: how two independent variables affect the response variable. II) Local optima: areas where the response variable reaches maximum or minimum values. III) Curvature, trends, and interactions: contour lines reveal variable relationships: straight and parallel indicate linearity; curved indicate non-linearity or interaction. Crossing lines imply significant interaction, while closed regions show high sensitivity to variable changes. IV) Critical points: inflection points can be identified where the response variable changes abruptly. Figure 8a shows lipid accumulation as a function of light intensity and whey concentration. It can be seen that the maximum response in the experimental design space is found at high light intensity and medium whey concentration. It is also observed that the contour lines do not close, suggesting that lipid production can be optimized by working with a higher number of lumens. Light intensity alone does not directly induce lipid accumulation, but increasing illumination can increase the effect of other stress factors. For example, increasing light intensity associated with an adequate substrate concentration could increase lipid content in the cells of the microalga Chlorella vulgaris. Figure 8b shows the accumulation of lipids as a function of light intensity and pH. It can be observed that there is a region of the design space at medium light intensity and pH levels where the contour lines close, indicating that there is a local maximum at that point. However, it can be noted that there are two regions where lipid production has the highest value; the first at high light intensity and low pH levels, the second at high light intensity and high pH levels. This result may be due to what was mentioned by Khalil et al. (2010); the microalga Chlorella vulgaris develops in a wide pH range (4-10). The interaction between light intensity and pH may be due to synergistic conditions, where at certain pH levels, the microalgae efficiently use the available light for lipid production or combined stress, that is, at extreme pH levels (low or high pH) and at high light intensity, the microalgae can change their metabolism towards lipid production as a defense mechanism. Figure 8c shows that the contour line closes, reaching a maximum lipid production at medium whey concentration and pH levels. This optimum found in this area of the experimental design may be due to an adequate pH level that allows better absorption of nutrients (nitrates, phosphates, and other essential nutrients present in the culture medium), which improves the metabolic activity towards lipid production.
3.6 Carbohydrate production
Investigating carbohydrate production in the microalga Chlorella vulgaris as a function of light intensity, whey concentration, and pH is important to optimize the accumulation of biomass with a high sugar content to produce biofuels such as bioethanol (Ma’mun et al., 2024; Silvello et al., 2023) or other value-added products such as biopolymers (Mehariya et al., 2023). Figure 9 presents the carbohydrate production in the different treatments. The highest carbohydrate production was achieved at low pH levels, with treatments 2 and 11 reaching a maximum accumulation of 14.48 mgcarbohydrate· gbiomass-1 and 14.54 mgcarbohydrate·gbiomass-1, respectively. It represents 1.44% and 1.45% of the dry biomass, respectively. Carbohydrates are stored as reserve polysaccharides in plastids or structures as the cell wall, and according to De Carvalho et al., (2022), carbohydrate production can vary with the type of strain and the culture conditions. Compared to other research works, Vyas et al. (2022), using the microalgae Chlorella sorokiniana, obtained a total carbohydrate concentration of 8.66% under heterotrophic conditions and with a carbon-nitrogen ratio of 20. Samiee-Zafarghandi et al. (2018) achieved a 60% accumulation of carbohydrate content in the microalga Chlorella vulgaris under a light intensity of 450 μmol photons·m-2s-1. Demonstrating that light intensity affects the composition and metabolism of microalgae. Daneshvar et al. (2018) achieved an accumulation of carbohydrates in the microalgae Chlorella vulgaris of 18% to 19%. They concluded that the microalga Chlorella vulgaris can potentially treat pulp wastewater while accumulating carbohydrates.
On the other hand, Baune et al. (2025) reported a carbohydrate accumulation in Chlorella vulgaris of between 40% and 60% on a dry basis, grown under heterotrophic conditions. The authors concluded that the drying method used has a significant impact on the analysis of nutrient composition, including total carbohydrates.
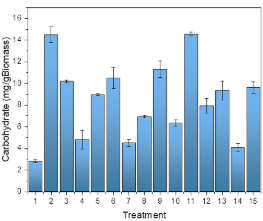
Figure 9. Intensity light, whey concentration, and pH effect on carbohydrate accumulation.
Figure 10 shows the influence of light intensity, whey concentration, and pH, in carbohydrate accumulation. It can be seen that light intensity and pH have a significant impact on carbohydrate production. It can also be seen that the light intensity factor has a quadratic effect (AA), the linear effect of light intensity being statistically more significant. Figure 10b reveals the statistical analysis of the main effects, where the following can be observed: I) The carbohydrate accumulation was proportional to the light intensity.
This increase in carbohydrates with increasing light intensity can be attributed to light being the main energy supplier for photosynthetic organisms. Its intensity affects the growth rate and biomass composition (Samiee-Zafarghandi et al., 2018). On the other hand, light is essential for photosynthesis, where light energy is converted into chemical energy. The higher the light intensity, the faster the photosynthesis, which increases the production of carbohydrates in the microalgae cells. However, according to what was already mentioned by Samiee-Zafarghandi et al. (2018), if the light intensity is excessive, it can cause photo-oxidative stress, which could reduce the accumulation of carbohydrates. Microalgae can use whey as a source of carbon and nitrogen, which affects their cellular metabolism in the Calvin cycle for photosynthesis, promoting carbohydrate synthesis. However, as shown in Figure 10b, the concentration of whey must be adequate since an excessive amount of whey can cause an osmotic imbalance, negatively affecting cell growth and carbohydrate accumulation. In Figure 10b, pH affects the accumulation of carbohydrates in microalgae, i.e., as pH increases, the concentration of carbohydrates decreases because pH influences the enzymatic activity and cellular regulation of microalgae. A non-optimal pH in the microalgae culture medium can affect the ionic balance, resulting in poor carbon fixation and decreasing the conversion of simple carbohydrates into complex carbohydrates.

Figure 10. a) Pareto graph. Standardized effects for carbohydrate production under light intensity, whey concentration, and pH. b) Main effects graph of carbohydrate production.
The response surface plot (Figure 11) shows the dependence of carbohydrate accumulation on two main factors. From these graphs, we can interpret the following: I) A flat surface shows no significant factor effect; a curved surface indicates a strong impact. II) From the combination of factor levels, it can be located where the response is maximum or minimum. III) Curvature suggests a factor interaction, i.e., the effect of one factor depends on the level of the other factor. IV) A steep slope means small factor changes greatly affect the response, while a flat surface indicates stability.
Figure 11a shows carbohydrate accumulation as a function of light intensity and whey concentration. It can be seen that the response surface with a very steep slope, with a stable zone of maximum response at a combination of high and intermediate levels of light intensity and whey concentration. The steep slope indicates that a small variation in the factors gives a large variation in carbohydrate accumulation and this may be due to a synergy between the factors.

Figure 11. Surface response plots for carbohydrate accumulation. a) light intensity-whey concentration, b) light intensity-pH, c) whey concentration-pH.
On the one hand, light provides the energy needed to carry out the photosynthesis process, while whey supplies nutrients for carbohydrate biosynthesis. However, a high light intensity could increase the nutrient demand due to a high photosynthesis rate. The figure also shows that at high light intensity and low whey concentration, carbohydrate accumu-lation tends to decrease due to metabolic stress due to a high nutrient demand. In Figure 11b, it can be observed that there is a local maximum in carbohydrate accumulation at medium levels of light intensity and pH. The global maximum is found at a combination of high and low levels of light intensity and pH, respectively. This response found in carbohydrate accumulation is because the increase in light intensity provides the energy necessary to accelerate the photosynthesis rate, while adequate pH regulates the efficient functioning of the enzymes involved in carbohydrate production. Figure 11c shows that Chlorella vulgaris has a pH range in which it uses the nutrients present in whey more efficiently, resulting in a greater accumulation of carbohydrates. On the other hand, a high concentration of whey at an inappropriate pH could induce osmotic stress and alter the metabolic balance of Chlorella vulgaris, which decreases carbohydrate accumulation.
The results indicated that lipid production exceeded carbohydrates, likely due to competition between lipid and carbohydrate synthesis pathways for a common carbon precursor (Nzayisenga et al., 2020). Therefore, it is suggested to block the synthesis of one of these compounds (lipids or carbohydrates) to increase the production of the compound of interest. Another hypothesis suggests that lipid and carbohydrate synthesis may occur simultaneously, but carbohydrates are degraded under stress to favor lipid accumulation, an adaptive energy storage mechanism. This is enhanced in heterotrophic or mixotrophic conditions, maximizing biomass and lipid production for bioenergy. According to He et al. (2015), lipid biosynthesis requires more energy than carbohydrates due to their 2.25 times higher energy value, making lipids efficient energy and carbon storage, especially under excess light.
4. Conclusions
This study demonstrated that biomass, lipid and carbohydrate production in Chlorella vulgaris is significantly influenced by light intensity, whey concentration, and pH. The results revealed that light intensity is the most critical factor, as it not only drives photosynthesis but also induces key metabolic responses, such as lipid synthesis, under light stress conditions. A biomass of 2.17 g·L-1 was achieved under high light intensity and pH conditions, with the modified Gompertz model effectively fitting growth for optimization. Treatments with high light intensity and medium whey concentrations achieved the highest lipid yields, with values of 83, 88, and 82 mg·g-1 of biomass, representing between 8.2% and 8.8% of dry biomass. This behavior is attributed to the microalga's ability to divert carbon towards lipid synthesis as a stress adaptation mechanism, particularly under conditions of high luminosity and nutrient availability. On the other hand, carbohydrate accumulation showed a marked dependence on pH and light intensity, with the highest yields (14.48 and 14.54 mg·g-1 of biomass) obtained under low pH and high light intensity conditions. This suggests that the microalga prioritizes carbohydrate synthesis under specific conditions, although it competes with lipid production for available carbon precursors. The quadratic relationship observed between whey concentration and lipid and carbohydrate production indicates that there is an optimal point for maximizing the accumulation of these compounds, beyond which excess whey can generate osmotic stress and reduce metabolic efficiency.
From contour plot and surface response graph, the study confirmed that the interaction between light intensity, whey, and pH is crucial for optimizing biomass and target compound production.
The results demonstrated that light intensity and whey concentration are critical factors in lipid and carbohydrate production, so it is recommended to study LED lighting tunable at different wavelengths. It is also suggested to find the optimal point that maximizes lipid accumulation without inducing osmotic stress. This includes intermediate values not evaluated in this study. Finally, a detailed analysis of lipid composition (fatty acid profile) and carbohydrates (simple and complex sugars) should be performed to determine their suitability for specific applications, such as biodiesel or bioethanol production.
Author contribution
D. Montalvo: Conceptualization, Investigation, Supervision, Formal analysis, Data curation, Writing – original draft, Writing – review and editing. F. Culebro: Investigation and Methodology. C. R. González-González: Investigation and Methodology. R. S. Gines-Palestino: Formal analysis, Data curation, Writing – review and editing. J. Reyes: Investigation and Methodology.
Conflict of Interests Statements
Authors have no conflict of interest to declare.
Acknowledgments
The authors thank the Instituto Tecnológico Superior de Acayucan, Veracruz, México, for providing space for this study and express special gratitude to MTI. José Moguel Muñoz and I.BQ. Isauro Arzola for their support.
ORCID
D. Montalvo https://orcid.org/0000-0001-7475-9616
F. Culebro https://orcid.org/0009-0002-9497-4342
C. R. González-González https://orcid.org/0000-0002-5837-4895
R. S. Gines-Palestino https://orcid.org/0000-0003-4850-6628
J. Reyes https://orcid.org/0009-0003-0488-6670
References
Alazaiza, M. Y. D., He, S., Su, D., Abu Amr, S. S., Toh, P. Y., & Bashir, M. J. K. (2023). Sewage water treatment using Chlorella vulgaris microalgae for simultaneous nutrient separation and biomass production. Separations, 10(4), 229. https://doi.org/10.3390/separations10040229
Alharbi, R. M. (2024). Anaerobic co-digestion of cow manure and microalgae to increase biogas production: A sustainable bioenergy source. Journal of King Saud University - Science, 36(9), 103380. https://doi.org/10.1016/j.jksus.2024.103380
Amaral, E. T., Bender, L. B. Y. C., Rizzetti, T. M., & Schneider, R. D. C. D. S. (2023). Removal of organic contaminants in water bodies or wastewater by microalgae of the genus Chlorella: A review. Case Studies in Chemical and Environmental Engineering, 8, 100476. https://doi.org/10.1016/j.cscee.2023.100476
Andrade, M. R., & Costa, J. A. V. (2007). Mixotrophic cultivation of microalga Spirulina platensis using molasses as organic substrate. Aquaculture, 264(1-4), 130-134. https://doi.org/10.1016/j.aquaculture.2006.11.021
AOAC (1980). Official methods of analysis of the association of official analytical chemists. William Horwitz. Washington, D.C., U.S.A. (1980).
Ararat, M. C., Sanclemente Reyes, O. E., & Vergara Patiño, L. (2020). Efecto de la dosificación de CO2 en la cinética de crecimiento de microalgas Chlorella vulgaris y Scenedesmus obliquuss. Revista de Investigación Agraria y Ambiental, 12(1), 89-100. https://doi.org/10.22490/21456453.3482
Ardila-Álvarez, A. M., López-Matos, Y., Vásquez-Cáceres, M. E., González-Delgado, Á. D., & Barajas-Solano, A. F. (2017). Obtención de lípidos y carbohidratos a partir de microalgas mediante el diseño de medios de cultivo selectivos. TecnoLógicas, 20(38), 83. https://doi.org/10.22430/22565337.581
Athanasiadou, V., Klontza, E. E., Dimitriou-Christidis, P., Fountoulakis, M., & Lekkas, D. F. (2023). Evaluation of Arthrospira (Spirulina) platensis growth on cheese whey in the context of circular economy. Sustainable Chemistry and Pharmacy, 34, 101173. https://doi.org/10.1016/j.scp.2023.101173
Baune, M.-C., Januschewski, E., Bussa, M., Van De Walle, S., Gifuni, I., Rodrigues, A. M. C., Cardoso, M. H., Van Royen, G., Juadjur, A., Jungbluth, N., Terjung, N., Castellari, M., & Fanari, F. (2025). Innovative vs. classical methods for drying heterotrophic Chlorella vulgaris: Impact on the nutritional properties, safety, sustainability and costs. Algal Research, 86, 103913. https://doi.org/10.1016/j.algal.2025.103913
Bazdar, E., Roshandel, R., Yaghmaei, S., & Mardanpour, M. M. (2018). The effect of different light intensities and light/dark regimes on the performance of photosynthetic microalgae microbial fuel cell. Bioresource Technology, 261, 350-360. https://doi.org/10.1016/j.biortech.2018.04.026
Bibi, F., Yasmin, H., Jamal, A., AL-Harbi, M. S., Ahmad, M., Zafar, M., Ahmad, B., Samra, B. N., Ahmed, A. F., & Ali, M. I. (2021). Deciphering role of technical bioprocess parameters for bioethanol production using microalgae. Saudi Journal of Biological Sciences, 28(12), 7595-7606. https://doi.org/10.1016/j.sjbs.2021.10.011
Bligh, E. G., & Dyer, W. J. (1959). A rapid method of total lipid extraction and purification. Canadian Journal of Biochemistry and Physiology, 37(8), 911-917. https://doi.org/10.1139/o59-099
Cantú, D., Villegas-Rodríguez, S., Gines-Palestino, R. S., Reyes, J., Cruz, J., & Salinas, D. M. (2024). Harnessing of whey and CO2 for the production of Arthrospira (Spirulina) platensis microalgae biomass: A circular economy approach. Acta Scientiarum. Biological Sciences, 46.
Chojnacka, K., & Noworyta, A. (2004). Evaluation of Spirulina sp. Growth in photoautotrophic, heterotrophic and mixotrophic cultures. Enzyme and Microbial Technology, 34(5), 461-465. https://doi.org/10.1016/j.enzmictec.2003.12.002
Coronado-Reyes, J. A., Salazar-Torres, J. A., Juárez-Campos, B., & González-Hernández, J. C. (2022). Chlorella vulgaris, a microalgae important to be used in Biotechnology: A review. Food Science and Technology, 42, e37320. https://doi.org/10.1590/fst.37320
Daneshvar, E., Antikainen, L., Koutra, E., Kornaros, M., & Bhatnagar, A. (2018). Investigation on the feasibility of Chlorella vulgaris cultivation in a mixture of pulp and aquaculture effluents: Treatment of wastewater and lipid extraction. Bioresource Technology, 255, 104-110. https://doi.org/10.1016/j.biortech.2018.01.101
De Almeida, T., Cardoso, V. L., & Batista, F. R. X. (2022). Feasibility of Chlorella vulgaris to waste products removal from cheese whey. International Journal of Environmental Science and Technology, 19(6), 4713-4722. https://doi.org/10.1007/s13762-021-03423-x
De Carvalho, M. A., Severo Gonçalves, I., Patrícia Held Azambuja, S., Silva Costa, S., Garcia Pereira Silva, P., Oliveira Santos, L., & Goldbeck, R. (2022). Microalgae-based carbohydrates: A green innovative source of bioenergy. Bioresource Technology, 344, 126304. https://doi.org/10.1016/j.biortech.2021.126304
De Farias Silva, C. E., Meneghello, D., De Souza Abud, A. K., & Bertucco, A. (2020). Pretreatment of microalgal biomass to improve the enzymatic hydrolysis of carbohydrates by ultrasonication: Yield vs energy consumption. Journal of King Saud University - Science, 32(1), 606-613. https://doi.org/10.1016/j.jksus.2018.09.007
Debnath, C., Bandyopadhyay, T. K., Bhunia, B., Mishra, U., Narayanasamy, S., & Muthuraj, M. (2021). Microalgae: Sustainable resource of carbohydrates in third-generation biofuel production. Renewable and Sustainable Energy Reviews, 150, 111464. https://doi.org/10.1016/j.rser.2021.111464
Dubois, M., Gilles, K. A., Hamilton, J. K., Rebers, P. A., & Smith, F. (1956). Colorimetric method for determination of sugars and related substances. Analytical Chemistry, 28(3), 350-356. https://doi.org/10.1021/ac60111a017
Ekeuku, S. O., Zainul Azlan, N., Mohd Yusof, Y. A., Tan, J. K., & Makpol, S. (2024). Unveiling the impact of Chlorella vulgaris supplementation on liver metabolisms of aged rats − A preclinical study. Journal of Functional Foods, 121, 106383. https://doi.org/10.1016/j.jff.2024.106383
Esteves, A. F., Salgado, E. M., Vilar, V. J. P., Gonçalves, A. L., & Pires, J. C. M. (2024). A growth phase analysis on the influence of light intensity on microalgal stress and potential biofuel production. Energy Conversion and Management, 311, 118511. https://doi.org/10.1016/j.enconman.2024.118511
Faruque, M. O., Hossain, M. M., & Razzak, S. A. (2025). A green approach to adaptive cultivation of Chlorella sorokiniana in oilfield hypersaline wastewater for sustainable biomass production, nutrient removal, and bioenergy potential. Green Technologies and Sustainability, 3(3), 100179. https://doi.org/10.1016/j.grets.2025.100179
Forero-Cujiño, M. A., Montengro Ruiz, L. C., Pinilla-Agudelo, G. A., & Melgarejo-Muñoz, L. M. (2016). Inmovilización de las microalgas Scenedesmus ovalternus (Scenedesmaceae) y Chlorella vulgaris (Chlorellaceae) en esferas de alginato de calcio. Acta Biológica Colombiana, 21(2), 437-442. https://doi.org/10.15446/abc.v21n2.51253
George, B., Pancha, I., Desai, C., Chokshi, K., Paliwal, C., Ghosh, T., & Mishra, S. (2014). Effects of different media composition, light intensity and photoperiod on morphology and physiology of freshwater microalgae Ankistrodesmus falcatus – A potential strain for bio-fuel production. Bioresource Technology, 171, 367-374. https://doi.org/10.1016/j.biortech.2014.08.086
He, Q., Yang, H., Wu, L., & Hu, C. (2015). Effect of light intensity on physiological changes, carbon allocation and neutral lipid accumulation in oleaginous microalgae. Bioresource Technology, 191, 219-228. https://doi.org/10.1016/j.biortech.2015.05.021
Jiao, H., Tsigkou, K., Elsamahy, T., Pispas, K., Sun, J., Manthos, G., Schagerl, M., Sventzouri, E., Al-Tohamy, R., Kornaros, M., & Ali, S. S. (2024). Recent advances in sustainable hydrogen production from microalgae: Mechanisms, challenges, and future perspectives. Ecotoxicology and Environmental Safety, 270, 115908. https://doi.org/10.1016/j.ecoenv.2023.115908
Josephine, A., Kumar, T. S., Surendran, B., Rajakumar, S., Kirubagaran, R., & Dharani, G. (2022). Evaluating the effect of various environmental factors on the growth of the marine microalgae, Chlorella vulgaris. Frontiers in Marine Science, 9, 954622. https://doi.org/10.3389/fmars.2022.954622
Khalil, Z. I., Asker, M. M. S., El-Sayed, S., & Kobbia, I. A. (2010). Effect of pH on growth and biochemical responses of Dunaliella bardawil and Chlorella ellipsoidea. World Journal of Microbiology and Biotechnology, 26(7), 1225-1231. https://doi.org/10.1007/s11274-009-0292-z
Koochi, Z. H., Jahromi, K. G., Kavoosi, G., & Ramezanian, A. (2023). Fortification of Chlorella vulgaris with citrus peel amino acid for improvement biomass and protein quality. Biotechnology Reports, 39, e00806. https://doi.org/10.1016/j.btre.2023.e00806
Li, D., Yuan, Y., Cheng, D., & Zhao, Q. (2019). Effect of light quality on growth rate, carbohydrate accumulation, fatty acid profile and lutein biosynthesis of Chlorella sp. AE10. Bioresource Technology, 291, 121783. https://doi.org/10.1016/j.biortech.2019.121783
Ma, X., & Jian, W. (2023). Growth conditions and growth kinetics of Chlorella vulgaris cultured in domestic sewage. Sustainability, 15(3), 2162. https://doi.org/10.3390/su15032162
Ma’mun, S., Prasetio, M. W., Anugrah, A. R., Ruliandi, A. P., & Pramuwardani, D. (2024). Bioethanol from Arthrospira platensis biomass using a combined pretreatment. Chemical Engineering Journal Advances, 19, 100616. https://doi.org/10.1016/j.ceja.2024.100616
Martínez Macias, M. D. R., Sánchez Duarte, R. G., Meza Escalante, E. R., Ulloa Mercado, R. G., & Saldívar Cabrales, J. (2017). Síntesis de lípidos de la microalga Nannochloropsis oculata para su uso potencial en la producción de biodiésel. Revista Internacional de Contaminación Ambiental, 33(esp02), 85-91. https://doi.org/10.20937/RICA.2017.33.esp02.08
Mehariya, S., Plöhn, M., Jablonski, P., Stagge, S., Jönsson, L. J., & Funk, C. (2023). Biopolymer production from biomass produced by Nordic microalgae grown in wastewater. Bioresource Technology, 376, 128901. https://doi.org/10.1016/j.biortech.2023.128901
Melo, R. G. D., Andrade, A. F. D., Bezerra, R. P., Correia, D. S., Souza, V. C. D., Brasileiro-Vidal, A. C., Viana Marques, D. D. A., & Porto, A. L. F. (2018). Chlorella vulgaris mixotrophic growth enhanced biomass productivity and reduced toxicity from agro-industrial by-products. Chemosphere, 204, 344-350. https://doi.org/10.1016/j.chemosphere.2018.04.039
Monjed, M. K., Achour, B., Robson, G. D., & Pittman, J. K. (2021). Improved saccharification of Chlorella vulgaris biomass by fungal secreted enzymes for bioethanol production. Algal Research, 58, 102402. https://doi.org/10.1016/j.algal.2021.102402
Montalvo, D., Corro, G., Bañuelos, F., Olivares-Xometl, O., Arellanes, P., & Pal, U. (2023). Selective alcohols production through CO2 photoreduction using Co3O4 /TiO2 photocatalyst exploiting synergetic interactions between Ti3+, Co2+ and Co3+. Applied Catalysis B: Environmental, 330, 122652. https://doi.org/10.1016/j.apcatb.2023.122652
Montalvo-Salinas, D., & Cantú-Lozano, D. (2018). Rheological performance of lactic acid production from whey using Kluyveromyces marxianus yeast. Effect of initial concentrations of substrate, inoculum and oxygen. Ciencia e Ingeniería, 39(3), 215-228.
Montalvo-Salinas, D., Ruiiz-Terán, F., Luna-Solano, G., & Cantú-Lozano, D. (2018). Modeling rheological of whey on function of shear rate, temperature and total solids concentration. Revista Tecnica De La Facultad De Ingenieria Universidad Del Zulia, 41(3), 156-164.
Najar-Almanzor, C. E., Velasco-Iglesias, K. D., Solis-Bañuelos, M., González-Díaz, R. L., Guerrero-Higareda, S., Fuentes-Carrasco, O. J., García-Cayuela, T., & Carrillo-Nieves, D. (2024). Chlorella vulgaris-mediated bioremediation of food and beverage wastewater from industries in Mexico: Results and perspectives towards sustainability and circular economy. Science of The Total Environment, 940, 173753. https://doi.org/10.1016/j.scitotenv.2024.173753
Nguyen, T. D. P., Nguyen, D. H., Lim, J. W., Chang, C.-K., Leong, H. Y., Tran, T. N. T., Vu, T. B. H., Nguyen, T. T. C., & Show, P. L. (2019). Investigation of the relationship between bacteria growth and lipid production cultivating of microalgae Chlorella Vulgaris in seafood wastewater. Energies, 12(12), 2282. https://doi.org/10.3390/en12122282
Nzayisenga, J. C., Farge, X., Groll, S. L., & Sellstedt, A. (2020). Effects of light intensity on growth and lipid production in microalgae grown in wastewater. Biotechnology for Biofuels, 13(1), 4. https://doi.org/10.1186/s13068-019-1646-x
Oliva, G., Buonerba, A., Grassi, A., Hasan, S. W., Korshin, G. V., Zorpas, A. A., Belgiorno, V., Naddeo, V., & Zarra, T. (2024). Microalgae to biodiesel: A novel green conversion method for high-quality lipids recovery and in-situ transesterification to fatty acid methyl esters. Journal of Environmental Management, 357, 120830. https://doi.org/10.1016/j.jenvman.2024.120830
Ozcelik, D., Suwal, S., Ray, C., Tiwari, B. K., Jensen, P. E., & Poojary, M. M. (2024). Valorization of dairy side-streams for the cultivation of microalgae for value added food products. Trends in Food Science & Technology, 146, 104386. https://doi.org/10.1016/j.tifs.2024.104386
Rajivgandhi, G., Ramachandran, G., Chelliah, C. K., Maruthupandy, M., Quero, F., S, V., AL-Mekhlafi, F. A., Wadaan, M. A., Ranjitha, J., & Li, W.-J. (2022). Green microalgal strain Chlorella vulgaris isolated from industrial wastewater with remediation capacity. Environmental Technology & Innovation, 28, 102597. https://doi.org/10.1016/j.eti.2022.102597
Rautenberger, R., Détain, A., Skjånes, K., Schulze, P. S. C., Kiron, V., & Morales-Sánchez, D. (2024). Growth strategies of Chlorella vulgaris in seawater for a high production of biomass and lipids suitable for biodiesel. Algal Research, 77, 103360. https://doi.org/10.1016/j.algal.2023.103360
Rodríguez-González, D., Colominas-Aspuro, A. M., & Zumbado-Fernández, H. M. (2024). Utilización de suero lácteo en la elaboración de una bebida refrescante con fructooligosacáridos y pulpa de acerola (Malpighia emarginata D.C.). Ciencia y Tecnología Agropecuaria, 25(3). https://doi.org/10.21930/rcta.vol25_num3_art:3692
Samiee-Zafarghandi, R., Karimi-Sabet, J., Abdoli, M. A., & Karbassi, A. (2018). Increasing microalgal carbohydrate content for hydrothermal gasification purposes. Renewable Energy, 116, 710-719. https://doi.org/10.1016/j.renene.2017.10.020
Sanjurjo, C., Oulego, P., Bartolomé, M., Rodríguez, E., Gonzalez, R., & Hernández Battez, A. (2024). Biodiesel production from the microalgae Nannochloropsis gaditana: Optimization of the transesterification reaction and physicochemical characterization. Biomass and Bioenergy, 185, 107240. https://doi.org/10.1016/j.biombioe.2024.107240
Silvello, M. A. D. C., Gasparotto, G. A., & Goldbeck, R. (2023). Enzymatic hydrolysis of carbohydrate-rich Chlorella vulgaris for third-generation bioethanol production by cellulase-recombinant yeast. Cleaner Chemical Engineering, 6, 100111. https://doi.org/10.1016/j.clce.2023.100111
Soleimani Khorramdashti, M., Samipoor Giri, M., & Majidian, N. (2021). Extraction lipids from Chlorella vulgaris by supercritical CO2 for biodiesel production. South African Journal of Chemical Engineering, 38, 121-131. https://doi.org/10.1016/j.sajce.2021.03.008
Van Nerom, S., Buyse, K., Van Immerseel, F., Robbens, J., & Delezie, E. (2024). Pulsed electric field (PEF) processing of microalga Chlorella vulgaris and its digestibility in broiler feed. Poultry Science, 103(6), 103721. https://doi.org/10.1016/j.psj.2024.103721
Vyas, S., Patel, A., Nabil Risse, E., Krikigianni, E., Rova, U., Christakopoulos, P., & Matsakas, L. (2022). Biosynthesis of microalgal lipids, proteins, lutein, and carbohydrates using fish farming wastewater and forest biomass under photoautotrophic and heterotrophic cultivation. Bioresource Technology, 359, 127494. https://doi.org/10.1016/j.biortech.2022.127494
Wong, Y. K., Ho, Y. H., Ho, K. C., Leung, H. M., & Yung, K. K. L. (2017). Maximization of cell growth and lipid production of freshwater microalga Chlorella vulgaris by enrichment technique for biodiesel production. Environmental Science and Pollution Research, 24(10), 9089-9101. https://doi.org/10.1007/s11356-016-7792-9
Yu, H., Chen, X., Du, X., Chang, Y., Sun, S., Tang, S., Du, Q., & Song, W. (2024). Exploring the molecular mechanism of Chlorella vulgaris in response to androstenedione exposure based on genes continuously up-regulated in transcription analysis. Ecotoxicology and Environmental Safety, 271, 115996. https://doi.org/10.1016/j.ecoenv.2024.115996
Zhang, K., Sun, B., She, X., Zhao, F., Cao, Y., Ren, D., & Lu, J. (2014). Lipid production and composition of fatty acids in Chlorella vulgaris cultured using different methods: Photoautotrophic, heterotrophic, and pure and mixed conditions. Annals of Microbiology, 64(3), 1239-1246. https://doi.org/10.1007/s13213-013-0766-y