RESEARCH ARTICLE
Evaluation of soil fertility index in organic, semi-organic, and conventional rice field management systems
Suntoro Suntoro1, * ; Ganjar Herdiansyah1 ; Heri Widijanto1 Slamet Minardi1 ;
Febridita Sari Dewi2
1 Study Program of Soil Science, Faculty of Agriculture, Universitas Sebelas Maret, Surakarta, Indonesia.
2 Student of Study Program of Soil Science, Faculty of Agriculture, Universitas Sebelas Maret, Surakarta, Indonesia.
* Corresponding author: suntoro@staff.uns.ac.id (S. Suntoro).
Received: 22 June 2023. Accepted: 19 February 2024. Published: 26 March 2024.
Abstract
Rice farming in Madiun Regency implements three different management systems, that is organic, semi-organic, and conventional. The different implementation of these rice field management systems impacts soil fertility index and rice productivity. This purpose of this research was to know the effect of rice field management systems on soil fertility index and rice productivity in the Madiun Regency. The research uses an explorative descriptive qualitative method with a survey approach. Soil samples were taken using a random sampling method and 3 types of soil management systems (conventional, semi-organic and organic), and rice production samples were taken using an estimation method. The research results show that the soil fertility index ranges from 0.78 to 0.82, which is high. The highest soil fertility index is in the semi-organic management system and the lowest is in the organic management. The management system of semi-organic gave a response to the highest rice production of 6.89 tons/ha. Management system of semi-organic is a better management for increasing and maintaining soil fertility and crop production than conventional or organic. Farming activities results show that organic management systems increase the highest income, increasing 115.58% and 53.30% in semi-organic compared to conventional. The rice field management system has the effect of increasing the worm population density with the highest in the organic system, namely 4.19 individuals m-2. The Pontoscolex worm type dominates the three management systems. There is a correlation between organic matter content and earthworms.
Keywords: Inorganic fertilizer; Organic fertilizer; Rice field management systems; Rice productivity; Soil fertility index.
DOI: https://doi.org/10.17268/sci.agropecu.2024.012
Cite this article:
Suntoro, S., Herdiansyah, G., Widijanto, H., Minardi, S., & Dewi, F. S. (2024). Evaluation of soil fertility index in organic, semi-organic, and conventional rice field management systems. Scientia Agropecuaria, 15(2), 163-175.
1. Introduction
The rapidly growing green revolution has been able to transform Indonesian agricultural practices since the 1960s in meeting food needs. In Indonesia, it was marked by the implementation of an agricultural intensification program. Agricultural intensification, understood as increasing aggregate yield per unit of land, is an effective effort to increase agricultural production, while preserving land resources (Garcia, 2020). Implementation of agricultural intensification in Indonesia by implementing agrochemicals in the form of chemical fertilizers, pesticides, and the use of superior varieties. In the history of national rice production, rice productivity could be increased from 2.3 t/ha in 1960 to 4.54 t/ha in 2004. The increase in production was achieved mainly by the availability of new short-lived superior varieties, the use of chemical fertilizers (urea, TSP, KCl), use of pesticides together with the application of IPM principles (Integrated Pest Management), and improvement of irrigation networks (Makarim & Suhartatik, 2006).
The agricultural intensification carried out so far has caused many problems. The continuous use of chemical fertilizers and pesticides, although it has greatly increased national and global food production, has damaged agricultural land, reduced the quality of agricultural products, and increased environmental risks (Penuelas et al., 2023). Disproportionate use of agrochemicals can have an impact on soil productivity, pollute water resources and be dangerous for human health (Soni et al., 2022), have an impact on decreasing soil carbon in the top 0-30 cm layer (Fitria & Kurniawan, 2023). Using fertilizers such as nitrogen, only around 50% of the N is applied effectively, while the rest is lost through various pathways to pollute the environment (Govindasamy et al., 2023). In addition, excessive use of chemical fertilizers, especially the addition of nitrogen, lowers soil pH and reduces the efficiency of fertilizer nutrient use (Liu et al., 2021). This is confirmed by Sharma & Chetani (2017) that the intensive use of conventional fertilizers in agriculture causes many health problems and environmental pollution. Agricultural systems have tended to exploit nutrients through intensive processing and unbalanced use of nutrients (Ravi Kumar et al., 2019), so that dependence on agrochemical inputs, or chemical fertilizers and pesticides, can affect soil quality and the efficiency of nutrient use (Iqbal et al., 2019).
Currently, many new agricultural practices have been developed, including organic farming, which is a sustainable agricultural approach with ecological principles (Soni et al., 2022). Agricultural development does not only focus on productivity but must also be sustainable as an answer to reducing environmental impacts (Rockström et al., 2017). The application of organic matter in the form of animal manure alongside conventional fertilizer not only helps to enrich the soil with organic matter but is also important for promoting soil health and soil quality (Swain et al., 2019). Some farmers support the need for chemical fertilizer with the addition of organic fertilizer that is environmentally friendly and cost-saving (Dikr & Belete, 2017).
Organic matter content is essential for soil fertility. Hoffland et al. (2020) state that one of the main roles of soil organic matter is in the soil ecosystem, where it serves as a source of plant nutrition, controlling the retention of macro and micronu-trients. Organic matter content determines soil fertility levels. For rice crops >3% is good and <3% is considered too low (Ilagan et al., 2014). The use of organic fertilizer such as animal manure not only provides the soil with organic carbon but also supplies plant nutrients, as well as having the residual effect of providing nutrients to aid plant growth in the next planting season (Iqbal et al., 2019). It is reported that this residual effect provides benefits up to the third year after application (Koutev & Nenov 2016). The use of livestock waste from the mineralization process not only increases the availability of N but also increases the availability of P, K, Zn, and Cu nutrients (Hirzel et al., 2010). Suntoro et al., (2018) show in their research that the addition of animal manure increases corn yield. The comprehensive application of organic and conven-tional fertilizer is an effective way to increase the productivity of rice plants (Liu et al., 2021). Soil fertility maintenance is a fundamental principle of sustainable farming (Sapinas & Abbott, 2020). This kind of maintenance can be carried out by calculating the Soil Fertility Index (SFI). The soil fertility index is calculated based on the value and quality of each indicator of soil fertility. Soil fertility indicators are chosen from the characteristics that indicate the capacity of soil function (Mujiyo et al., 2020). Intensive management systems lead to a reduction in soil fertility. There is a need for the right kind of management to improve soil fertility. Soil fertility is one of the necessary conditions for increasing rice productivity. In general, organic production systems are associated with lower productivity per area unit than conventional systems, and the challenge is to overcome the problem of inadequate nutrient supply, which is one of the main causes of lower productivity.
Sustainable agricultural management systems can have an impact on the sustainability of the food system, because they can affect human health as well as animal welfare, food security and environmental sustainability (Mie et al., 2017). Organic farming can be a major pathway towards socio-economic and ecologically sustainable development, especially in developing countries. This can be achieved by using agronomic, biological and mechanical methods on agricultural land with no synthetic inputs outside of agriculture (Soni et al., 2022). Ma et al. (2023) in his research emphasized that organic fertilizer increases the nutrient content and biological indicators of the soil to a greater extent than chemical fertilizer alone; The effect of applying organic fertilizer on combined soil enzyme activity was also higher than applying chemical fertilizer alone.
The Indonesian government began promoting organic farming in 2001, with the launch of the 'Go Organic 2010 Program' (Schreer & Padmanabhan, 2020). Organic farming in Indonesia is currently developing very rapidly. Farmers' confidence in practicing organic farming still varies between semi-organic and full organic. Therefore, this research aims to evaluate the soil fertility index in organic, semi-organic and conventional Rice field manage-ment systems.
2. Methodology
Field survey
This research was conducted in Madiun Regency, East Java, Indonesia (Figure 1). The research uses an explorative descriptive method with a survey approach. Soil sampling used a stratified purposive sampling method (Soil Survey Staff, 2014), soil type was Vertisols (Soil Survey Staff, 2022), and 3 types of soil management systems (conventional, semi-organic, and an organic). A total of 24 soil samples and production samples were observed. These samples consisted of 6 sampling points from organic rice fields, 6 sampling points from semi-organic rice fields, and 12 sampling points from conventional rice fields. The soil samples were taken from a depth of 0-20 cm (Supriyadi et al., 2021) and the plant production samples were taken when the rice plants were 90-120 days after planting.
Soil analysis and field production
A chemical analysis was carried out in the Laboratory of Soil Chemistry in the Soil Science Study Program, in the Faculty of Agriculture, at Universitas Sebelas Maret, Indonesia. The soil parameters analyzed included moisture content (gravimetric method), pH H2O (electrometric method), soil organic carbon (walkley and black method), total N (Kjeldahl method), total P (25% HCl extraction method), available K (ammonium acetate saturation method), cation exchange capa-city (CEC) (ammonium acetate saturation method), and Ca, Na, Mg exchangeable (flamefotometry), and base saturation (BS) (ammonium acetate saturation method) (Eviati & Sulaeman, 2021). The plant production parameters included estimation of weight (the grain dry weight) and 1000 seed weight. The estimation method is caried out an area of 2.5 m x 2.5 m.
Data analysis
The determination of soil fertility index began with a Person Correlation Analysis to observe how close the relationships were between the variables tested. This was followed by a Principal Component Analysis (PCA) to find the data that would be used as the primary components. The data from the PCA with the highest scores and high correlation were chosen as the Minimum Data Set (MDS) to represent all the indicators of soil fertility. Calculation of the soil fertility index referred to Mukashema (2007): SFI : 
SFI: Soil Fertility Index; Sci: total Minimum Soil FertiIity Index weights (= total score weight (cj) x appreciation value (pc)); N: total Minimum Soil Fertility Index (MSFI).
Table 1
Classification of Soil Fertility Index Class
Soil Fertility Index | Class |
0-0.25 | Very low |
0.25-0.50 | Low |
0.50-0.75 | Medium |
0.75-0.90 | High |
0.90-1 | Very high |
Source: Bagherzadeh et al. (2018).
The SFI obtained was further analyzed using (ANOVA), followed by a Duncan’s Multiple Range Test (DMRT). The ANOVA was used to examine the influence of rice field management on soil fertility index. The soil fertility index classification, based on Bagherzadeh et al. (2018) (Table 1).
A high level of rice production does not necessarily correspond to a high level of income. The price of dry rice is significantly different per kilogram in organic, semi-organic, and conventional manage-ment. Based on information from local farmers, the price of dry organic rice was reported to be around IDR.10,000/kg, while semi-organic rice was IDR.6,500/kg, and conventional rice was IDR.4,500/kg. These price differences meant that income per hectare for each rice management type differed significantly (Figure 6). The highest income per hectare was obtained in organic management, with a total of 61.709.333 IDR, and the lowest income was in conventional management, with a total of 28.625.400 IDR. This shows that a high production level per hectare does not necessarily mean a high farmer income. In this research, organic management resulted in the highest income compared with semi-organic and conventional management. According to Wihastuti et al. (2017) the R/C ratio in organic farming is 1.97 IDR, a value that is highly profitable for a farming enterprise. Semi-organic management resulted in a higher rice production than organic and conven-tional management, but the highest profit was obtained in organic management.
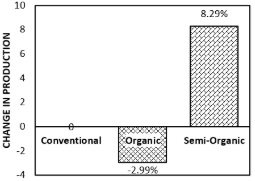
Figure 7. Change in production yield of organic and semi-organic rice compared with conventional production.
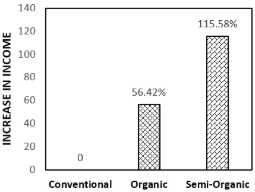
Figure 8. Increase in income from organic and semi-organic rice production compared with conventional production.
Figure 7 shows the change in organic and semi-organic rice production yield compared with conventional production. In semi-organic mana-gement, it can be seen that there is an increase of 8.29% compared with conventional production, while organic production shows a decrease of 2.99% compared with conventional management. This indicates that in the Madiun Regency, the semi-organic management system can increase rice production yield compared with conventional production. Treatment that combines half a dose of inorganic fertilizer and half a dose of organic fertilizer produces high and consistent results compared with a full dose of inorganic or organic fertilizer (Werede et al., 2018). From the point of view of rice production, the quantity of organic rice production is still unable to match the quantity of rice produced through conventional management. Based on the results of the farming activities analysis, it shows that the income level of farmers in organic management systems is higher than semi-organic and conventional management systems (Figure 8). Organic management can increase income by 115.58% compared with conventional management. Semi-organic management also increases income by 53.30% compared with conventional management. This is due to the increase in the price of organic rice which is higher than the price of semi-organic and conventional rice, besides that the costs incurred by farmers are lower. Organic farming can be used as a solution for sustainable farming. In addition, implementing organic farming is more beneficial as it can suppress production costs and offers a higher profit than semi-organic and conventional farming.
4. Conclusions
Soil fertility index ranged from 0.78 to 0.82 with high criteria. The highest score is found in the semi-organic management system and the lowest is in the organic management system. Semi-organic management systems show higher Soil Fertility Index results than other managements because the application of a combination of chemical and organic fertilizers is more effective in increasing soil fertility. The semi-organic management system responded to the highest rice production, namely 6.89 tons/ha. Semi-organic management systems are a better alternative for increasing and maintaining soil fertility and crop production than conventional and organic management systems. The results of the analysis of farming activities, the organic farming management system shows the highest increase in income of 115.58% and 53.30% for semi-organic compared to conventional sys-tems. The organic rice field management system has the effect of increasing the population density of worms as the key to sustainable agriculture. The types of earthworms found were dominated by Pontoscolex sp., besides Lumbricus sp., and Pheretima sp. There is a correlation between organic matter content and earthworms.
ORCID
S. Suntoro https://orcid.org/0000-0003-0369-7539
G. Herdiansyah https://orcid.org/0000-0001-5841-4642
H. Widijanto https://orcid.org/0000-0002-1781-7004
S. Minardi https://orcid.org/0000-0003-1097-2033
F. S. Dewi https://orcid.org/0009-0009-0357-0539
References
Adekiya, A. O., Aremu, C., Agbede, T. M., Olayanju, A., Ejue, W. S., et al. (2021). Soil productivity improvement under different fallow types on Alfisol of a derived savanna ecology of Nigeria. Heliyon, 7(4), e06759. https://doi.org/10.1016/j.heliyon.2021.e06759
Agegnehu, G., Vanbeek, C., & Bird, M. I. (2014). Influence of integrated soil fertility management in wheat and tef productivity and soil chemical properties in the highland tropical environment. Journal of soil science and plant nutrition, 14(3), 532-545. https://doi.org/10.4067/s0718-95162014005000042
Alam, M. M., Hossain, A. M., Hakim, A., Islam, M. R., Soufan, W., et al. (2024). Application of vermicompost to boro rice (BRRI dhan 28) can save phosphate fertilizer with sustaining productivity and soil fertility. Pakistan Journal of Botany, 56(1). https://doi.org/10.30848/pjb2024-1(18)
Bagherzadeh, A., Gholizadeh, A., & Keshavarzi, A. (2018). Assessment of soil fertility index for potato production using integrated fuzzy and AHP approaches, northeast of Iran. Eurasian Journal of Soil Science. https://doi.org/10.18393/ejss.399775
Bande, L. O. S., Hadisutrisno, B., Somowiyarjo, S., Sunarminto, B. H., & Wahab, A. (2016). Correlation of physical and chemical soil characteristics with intensity of foot rot disease of black pepper. Jurnal Littri, 22(2), 63-70.
Bergstrand, K. J. (2022). Organic fertilizers in greenhouse production systems - a review. Scientia Horticulturae, 295(November 2021), 110855. https://doi.org/10.1016/j.scienta.2021.110855
C. D. Darmawan, V. A. Mendrofa, A. M. Fuah, & Winarno. (2023). Productivity of Earthworms (Pheretima sp.) with the Combination of Cow Dung and Flour of Green Mussel Shell Flour as Cultivation Media. Jurnal Ilmu Produksi dan Teknologi Hasil Peternakan, 11(2). https://doi.org/10.29244/jipthp.11.2.88-93
Chase, P., & Singh, O. P. (2014). Soil nutrients and fertility in three traditional land use systems of Khonoma, Nagaland, India. Resources and Environment, 4(4), 181-189. https://doi.org/10.5923/j.re.20140404.01
Chaulagain, A., Dhurva, P., & Lamichhane, J. (2017). Vermicompost and its Role in Plant Growth Promotion. International Journal of Research, 04(08 July 2017).
Dewi, W. S., Puspaningrum, A., Tinuntun, R. S. T., Suntoro, S., & Mujiyo, M. (2022). A Modified Soil Fertility Assessment Method Using Earthworm Density and Microbial Biomass C at Various Land Uses in Wonogiri, Indonesia. International Journal of Design and Nature and Ecodynamics, 17(6). https://doi.org/10.18280/ijdne.170614
Dharmayanti, N. K. S., Supadma, A. . N., & Arthagama, I. D. M. (2013). Pengaruh Pemberian Biourine dan Dosis Pupuk Anorganik (N,P,K) Terhadap Beberapa Sifat Kimia Tanah Pegok dan Hasil Tanaman Bayam (Amaranthus sp.) NI. E-Jurnal Agroeteknologi Tropika, 2(3), 165-174. https://doi.org/10.1126/science.345.6196.499
Dikr, W., & Belete, K. (2017). Review on the Effect of Organic fertilizers, Biofertilizers and Inorganic Fertilizers (NPK) on Growth and Flower Yield of Marigold (Targets’ erecta L.) Cropping system and crop physiology View project Aromatic and medicinal plant View project. J. Agri. Sci. Res, 5(May), 192-204. https://doi.org/10.14662/ARJASR2017.016
Dulaurent, A. M., Daoulas, G., Faucon, M. P., & Houben, D. (2020). Earthworms (Lumbricus terrestris L.) mediate the fertilizing effect of frass. Agronomy, 10(6). https://doi.org/10.3390/agronomy10060783
Eviati, & Sulaeman. (2021). Petunjuk Teknis Analisis kimia tanah, tanaman, air dan pupuk. Balai Penelitian Tanah (3 ed.). Bogor Indonesia: Balai Penelitian Tanah.
Fitria, A. D., & Kurniawan, S. (2023). Can Landuse Intensification Decrease Soil Carbon Stock in Upstream Sumber Brantas Watershed? Jurnal Biologi Tropis, 23(3). https://doi.org/10.29303/jbt.v23i3.4979
Gamasika, F., Yusnaini, S., Niswati, A., & Dermiyati, D. (2017). Populasi dan biomassa cacing tanah pada berbagai vegetasi di setiap kemiringan lereng serta korelasinya terhadap kesuburan tanah di laboratorium lapang terpadu fakultas pertanian universitas lampung. Jurnal Agrotek Tropika, 5(3). https://doi.org/10.23960/jat.v5i3.1825
Garcia, A. (2020). The environmental impacts of agricultural intensification. SPIA Technical Note, (9).
Govindasamy, P., Muthusamy, S. K., Bagavathiannan, M., Mowrer, J., Jagannadham, P. T. K., et al. (2023). Nitrogen use efficiency—a key to enhance crop productivity under a changing climate. Frontiers in Plant Science. https://doi.org/10.3389/fpls.2023.1121073
Hailu, H. G., & Mezegebo, G. kidu. (2021). adoption on sesame productivity : evidence from Estimating the impact of inorganic fertilizer adoption on sesame productivity : evidence from Humera , Tigray , Ethiopia. Cogent Food & Agriculture, 1(7). https://doi.org/10.1080/23311932.2021.1933798
Heryanto, M. A., Sukayat, Y., & Supyandi, D. (2016). Model behaviour of farmers in the adoption of rice organic farming system : paradox of socio - economic - environmental. Sosiohumaniora, 18(2), 159-165. https://doi.org/doi.org/10.24198
Hirzel, J., Undurraga, P., & Walter, I. (2010). Nitrogen Mineralization and Released Nutrients in a Volcanic Soil Amended with Poultry Litter. Chilean journal of agricultural research, 70(1). https://doi.org/10.4067/s0718-58392010000100012
Hoffland, E., Kuyper, T. W., Comans, R. N. J., & Creamer, R. E. (2020). Eco-functionality of organic matter in soils. Plant and Soil, 455(1-2). https://doi.org/10.1007/s11104-020-04651-9
Ilagan, L. A., Tablizo, R. P., Jr, R. B. B., & Marquez, N. A. (2014). Soil fertility evaluation for rice production in Catanduanes province, Philippines. International Journal of Scientific & Technology Research, 3(12), 81-87.
Iqbal, A., He, L., Khan, A., Wei, S., Akhtar, K., et al. (2019). Organic manure coupled with inorganic fertilizer: An approach for the sustainable production of rice by improving soil properties and nitrogen use efficiency. Agronomy, 9(10). https://doi.org/10.3390/agronomy9100651
Kai, T., Kumano, M., & Tamaki, M. (2020). A Study on Rice Growth and Soil Environments in Paddy Fields Using Different Organic and Chemical Fertilizers. Journal of Agricultural Chemistry and Environment, 09(04), 331-342. https://doi.org/10.4236/jacen.2020.94024
Koutev, V., & Nenov, M. (2016). Spatial and temporal changes of soil organic carbon after improper application of farmyard manure - On farm study. Bulgarian Journal of Agricultural Science, 22(3).
Kresnatita, S., Koesriharti, & Santoso, M. (2013). Effects of Organic Manure on Growth and Yield of Sweetcorn. Indonesia Green Technology Journal, 2(1), 8-17.
Liu, J., Shu, A., Song, W., Shi, W., Li, M., et al. (2021). Long-term organic fertilizer substitution increases rice yield by improving soil properties and regulating soil bacteria. Geoderma, 404. https://doi.org/10.1016/j.geoderma.2021.115287
Ma, G., Cheng, S., He, W., Dong, Y., Qi, S., Tu, N., & Tao, W. (2023). Effects of Organic and Inorganic Fertilizers on Soil Nutrient Conditions in Rice Fields with Varying Soil Fertility. Land, 12(5), 1026.. https://doi.org/10.3390/land12051026
Mahmud, A. J., Shamsuddoha, A. T., & Haque, N. (2016). Effect of organic and inorganic fertilizer on the growth and yield of rice (Oryza sativa L.). Nature and Science, 14, 45–54.
Makarim, A. K., & Suhartatik, E. (2006). Budi Daya Padi dengan Masukan In Situ Menuju Perpadian Masa Depan. Iptek Tanaman Pangan, 1, 19-29.
Mie, A., Andersen, H. R., Gunnarsson, S., Kahl, J., Kesse-Guyot, E., et al. (2017). Human health implications of organic food and organic agriculture: A comprehensive review. Environmental Health, 16, 111. https://doi.org/10.1186/s12940-017-0315-4
Mujiyo, Suntoro, Tyas, R. P., Herawati, A., & Widiyanto, H. (2020). Mapping Soil Quality in Various Land Uses as a Basis for Soil Management in Wonogiri, Indonesia. Journal of Settlements and Spatial Planning, 11(2), 127-135. https://doi.org/10.24193/JSSP.2020.2.06
Mukashema, A. (2007). Mapping and Modelling Landscape-based Soil Fertility Change in Relation to Human Induction Case study : GISHWATI Watershed of the Rwandan highlands. ITC University of Twenty, Enschede, The Netherlands.
Mulyani, O., Salim, E. H., Yuniarti, A., Machfud, Y., Sandrawati, A., & Dewi, M. P. (2017). Studi perubahan unsur kalium akibat pemupukan dan pengaruhnya terhadap hasil tanaman. SoilREns, 15(1), 53-61. https://doi.org/10.24198/soilrens.v15i1.13348
Murnita, & Taher, Y. A. (2021). Dampak pupuk organik dan anorganik terhadap perubahan sifat kimia tanah dan produksi tanaman padi ( Oriza sativa L .). Menara Ilmu, XV(02), 67-76.
Ngantung, J. A. B., Rondonuwu, J. J., & Kawulusan, R. I. (2018). Respon tanaman sawi hijau (Brassica juncea L.) terhadap pemberian pupuk organik dan anorganik di kelurahan rurukan kecamatan tomohon timur. Eugenia, 24(1), 44-52. https://doi.org/10.35791/eug.24.1.2018.21652
Nguemezi, C., Tematio, P., Yemefack, M., Tsozue, D., & Silatsa, T. B. F. (2020). Soil quality and soil fertility status in major soil groups at the Tombel area, South-West Cameroon. Heliyon, 6(2). https://doi.org/10.1016/j.heliyon.2020.e03432
Pakpahan, I., Guchi, H., & Jamilah. (2019). Pemetaan kandungan P-tersedia, P-total dan logam berat kadmium pada lahan sawah di Desa Pematang Nibung Kecamatan Medang Deras Kabupaten Batu Bara. J. Agroekoteknologi FP USU, 7(2), 448-457.
Penuelas, J., Coello, F., & Sardans, J. (2023). A better use of fertilizers is needed for global food security and environmental sustainability. Agriculture and Food Security. https://doi.org/10.1186/s40066-023-00409-5
Ravi Kumar, D., KT, B. N., Ganapathi, G., et al. (2019). Soil fertility status of available micronutrients and mapping in Beguru Microwatershed of Tarikere Taluk of Chikkmagaluru District, Karnataka, India. Pharmacognosy and phytochemistry, 8(4), 2598-2601.
Rockström, J., Williams, J., Daily, G., Noble, A., Matthews, N., et al. (2017). Sustainable intensification of agriculture for human prosperity and global sustainability. Ambio, 46(1). https://doi.org/10.1007/s13280-016-0793-6
Sapinas, I. P., & Abbott, L. K. (2020). Soil Fertility Management Based on Certified Organic Agriculture Standards - a Review. Sustainable Agriculture Research, 9(2), 1. https://doi.org/10.5539/sar.v9n2p1
Schreer, V., & Padmanabhan, M. (2020). The many meanings of organic farming: framing food security and food sovereignty in Indonesia. Organic Agriculture, 10(3). https://doi.org/10.1007/s13165-019-00277-z
Scotti, R., Bonanomi, G., Scelza, R., Zoina, A., & Rao, M. A. (2015). Organic amendments as sustainable tool to recovery fertility in intensive agricultural systems. Journal of Soil Science and Plant Nutrition. https://doi.org/10.4067/s0718-95162015005000031
Sharma, A., & Chetani, R. (2017). A Review on the Effect of Organic and Chemical Fertilizers on Plants. International Journal for Research in Applied Science and Engineering Technology, V(II), 677-680. https://doi.org/10.22214/ijraset.2017.2103
Siwanto, T., Sugiyanta, & Melati, M. (2015). Peran Pupuk Organik dalam Peningkatan Efisiensi Pupuk Anorganik pada Padi Sawah (Oryza sativa L.). Indonesian Journal of Agronomy, 43(1), 8. https://doi.org/10.24831/jai.v43i1.9582
Soil Survey Staff. (2014). Soil Survey Field and Laboratory Methods Manual. USDA-NRCS Web Soil Survey WebSoil Survey Investigations. https://doi.org/10.13140/RG.2.1.3803.8889
Soil Survey Staff. (2022). Keys to soil taxonomy. United States Department of Agriculture Natural Resources Conservation Service (13 ed., Vol. 13). Diambil dari.
Soni, R., Gupta, R., Agarwal, P., & Mishra, R. (2022). Organic Farming : A Sustainable Agricultural Practice. Vantage: Journal of Thematic Analysis, 3(1), 21-44.
Stevenson, F. (1994). Humus Chemistry: Genesis, Composition, Reactions. Humus Chemistry, 72(4).
Sufardi, Martunis, L., & Muyassir. (2017). Pertukaran kation pada beberapa jenis tanah di lahan kering Kabupaten Aceh Besar Provinsi Aceh (Indonesia). In Prosiding Seminar Nasional Pascasarjana Unsyiah, 3(2017), 45-53.
Sugiono, D., & Saputro, N. W. (2016). Respon Pertumbuhan dan Hasil Beberapa Genotip Padi (Oryza sativa L.). Pada Berbagai Sistem Tanam, 34(2), 105-114.
Suntoro. (2003). Peranan Bahan Organik Terhadap Kesuburan Tanah dan Upaya Pengelolaannya.
Suntoro, S., Widijanto, H., Suryono, Syamsiyah, J., Afinda, D. W., Dimasyuri, N. R., & Triyas, V. (2018). Effect of cow manure and dolomite on nutrient uptake and growth of corn (Zea mays l.). Bulgarian Journal of Agricultural Science, 24(6), 1020–1026.
Supriyadi, S., Sih Dewi, W., Nugrahani, D., Rahmah, A. A., Haryuni, H., & Sumani, S. (2019). The assessment of soil quality index for paddy fields with indicator biology in Jatipurno Districts, Wonogiri. Modern Applied Science, 14(1), 20. https://doi.org/10.5539/mas.v14n1p20
Supriyadi, S., Vera, I. L. P., & Purwanto, P. (2021). Soil Quality at Rice Fields with Organic, Semi-organic and Inorganic Management in Wonogiri Regency, Indonesia. Caraka Tani: Journal of Sustainable Agriculture, 36(2). https://doi.org/10.20961/carakatani.v36i2.42556
Swain, N., Mishra, A., Saren, S., Dash, P. K., Digal, M., & Mishra, B. B. (2019). Soil Fertility Status of Some Villages in Khordha and Bhubaneswar Block of Khordha District under North Eastern Ghat Agro Climatic Zone of Odisha, India. International Journal of Current Microbiology and Applied Sciences. https://doi.org/10.20546/ijcmas.2019.801.043
Tadesse, T., Dechassa, N., Bayu, W., & Gebeyehu, S. (2013). Effects of Farmyard Manure and Inorganic Fertilizer Application on Soil Physico-Chemical Properties and Nutrient Balance in Rain-Fed Lowland Rice Ecosystem. American Journal of Plant Sciences, 4, 309-316.
Tomašić, M., Žgorelec, Ţ., Jurišić, A., & Kisić, I. (2013). Cation exchange capacity of dominant soil types in the Republic of Croatia. Journal of Central European Agriculture, 14(3), 84-98. https://doi.org/10.5513/JCEA01/14.3.1286
Tongka, G. N., Wardah, & Yusran, Y. (2019). Kondisi kimia tanah di bawah tegakan pinus (Pinus merkusii jungh. Et de vriese) dan padang rumput Desa Watutau Kecamatan Lore Peore Kabupaten Poso Sulawesi Tengah. Jurnal Forest Sains, 16(2). https://doi.org/10.14421/jbs.1209
Werede, M. H., Smith, J. U., & Ambaye, S. B. (2018). Integrated soil fertility management for sustainable teff (Eragrostistef) production in Integrated soil fertility management for sustainable teff (Eragrostistef) production in. Cogent Food & Agriculture, 4(1), 1-9. https://doi.org/10.1080/23311932.2018.1519008
Widiatmika, I. K. W., Wijana, G., & Artha, D. A. N. I. N. (2017). Pengaruh Beberapa Jenis Pupuk dan Umur Bibit terhadap Pertumbuhan dan Hasil Tanaman Padi (Oryza sativa L.). Agrotop, 7(2), 189-198.
Wihastuti, W., Sujaya, D. H., & Hardiyanto, T. (2017). Analisis Usahatani Padi Organik (Studi Kasus Pada Kelompok Tani Kelapa Herang di Desa Setiawaras, Kecamatan Cibalong, Kabupaten Tasikmalaya). Jurnal Ilmiah Mahasiswa Agroinfo Galuh, 4(3), 388-395.
Yang, R., Su, Y. Z., Wang, T., & Yang, Q. (2016). Effect of chemical and organic fertilization on soil carbon and nitrogen accumulation in a newly cultivated farmland. Journal of Integrative Agriculture, 15(3), 658-666. https://doi.org/10.1016/S2095-3119(15)61107-8