Comparison of reference evapotranspiration estimated by Penman-Monteith and a Class A pan across the 2016 and 2017 dry seasons in Yopal, Casanare, Colombia
Comparación de la evapotranspiración de referencia estimada mediante Penman-Monteith y tanque Clase A durante los periodos secos de 2016 y 2017 en Yopal, Casanare, Colombia
Gustavo Castro-García1
1 Departamento de Ingeniería Agrícola y Biosistemas, Universidad de Puerto Rico-Mayagüez. Po Box 9000, Mayagüez, Puerto Rico.
ORCID de los autores:
G. Castro-García: https://orcid.org/0000-0003-0512-8890
ABSTRACT
Reliable estimation of reference evapotranspiration (ETo) is essential for irrigation scheduling in the Colombian Orinoquia, where incomplete agrometeorological records often limit the routine application of data-demanding methods. This study compared ETo estimated by the FAO Penman-Monteith method and by a Class A evaporation pan in Yopal, Casanare, during the 2016 and 2017 dry seasons, testing whether the pan could reproduce Penman-Monteith ETo without significant bias. A total of 52 paired observations were analyzed, with 26 records for each year. Penman-Monteith ETo was calculated from Davis WeatherLink meteorological data following FAO-56 procedures, while pan-based ETo was obtained from measured evaporation using a fixed pan coefficient (Kp) of 0.70. Across both years, mean ETo was 4.24 mm d⁻¹ for Penman-Monteith and 5.40 mm d⁻¹ for the Class A pan, with a significant pooled bias of 1.17 mm d⁻¹ (p < 0.001). Agreement was moderate overall, but strongly dependent on year. The pan performed well in 2017, yet substantially overestimated ETo in 2016. These results indicate that a fixed Kp of 0.70 is not temporally stable, and that local calibration and validation across seasons are necessary before the Class A pan can be used as a substitute for Penman-Monteith in Yopal.
Keywords: reference evapotranspiration; Class A pan; Penman-Monteith; irrigation scheduling; Orinoquia.
RESUMEN
La estimación confiable de la evapotranspiración de referencia (ETo) es esencial para la programación del riego en la Orinoquia colombiana, donde los registros agrometeorológicos incompletos suelen limitar la aplicación rutinaria de métodos que requieren una alta disponibilidad de datos. Este estudio comparó la ETo estimada mediante el método FAO Penman-Monteith y mediante un tanque de evaporación Clase A en Yopal, Casanare, durante las estaciones secas de 2016 y 2017, con el fin de evaluar si el tanque podía reproducir la ETo de Penman-Monteith sin un sesgo significativo. Se analizaron 52 observaciones pareadas, con 26 registros por año. La ETo por Penman-Monteith se calculó a partir de datos meteorológicos de Davis WeatherLink siguiendo los procedimientos FAO-56, mientras que la ETo basada en el tanque se obtuvo a partir de la evaporación observada usando un coeficiente fijo del tanque (Kp) de 0,70. En el conjunto de ambos años, la ETo media fue de 4,24 mm d⁻¹ para Penman-Monteith y de 5,40 mm d⁻¹ para el tanque Clase A, con un sesgo conjunto significativo de 1,17 mm d⁻¹ (p < 0,001). La concordancia general fue moderada, pero mostró una marcada dependencia del año. El tanque presentó un buen desempeño en 2017, pero sobreestimó considerablemente la ETo en 2016. Estos resultados indican que un Kp fijo de 0,70 no es temporalmente estable, y que se requiere calibración local y validación en varias estaciones antes de que el tanque Clase A pueda usarse como sustituto de Penman-Monteith en Yopal.
Keywords: evapotranspiración de referencia; tanque Clase A; Penman-Monteith; programación del riego; Orinoquia.
1. Introduction
Reference evapotranspiration (ETo) expresses the evaporative demand of the atmosphere over a well-watered reference surface and constitutes a central variable for estimating crop water requirements, defining irrigation calendars, and evaluating water availability in agricultural systems (Elbeltagi et al., 2022). In tropical regions characterized by marked climatic variability, local estimation of ETo is particularly important because even small errors may result in under-irrigation or over-irrigation, with direct consequences for crop productivity and water-use efficiency (Mendoza and Peña, 2021). The FAO Penman-Monteith method is the most widely accepted reference procedure for ETo estimation (Allen et al., 1998; Valle Júnior et al., 2021); however, its application requires reliable records of solar radiation, air temperature, relative humidity and wind speed. In many agricultural areas, continuous access to these variables is limited, which has maintained the use of the Class A evaporation pan as a practical field alternative (Jensen et al., 1990). The main advantage of the pan lies in its operational simplicity, although its performance depends on the adopted pan coefficient and on local exposure and management conditions (Cunha et al., 2013; Nikolaou et al., 2025).
Meteorological ETO monitoring in South American regions is limited, resulting in scarce high-quality data (Cemek et al., 2025). Specifically, estimating missing data can significantly affect ETo calculations. For example, Cordova et al. (2015) reported errors of up to 24% for solar radiation, 14% for relative humidity, and over 30% when all data except temperature are estimated. This underscores the critical need for reliable meteorological data to accurately predict ETo for irrigation in southern Ecuador and similar regions in South America. Recent literature from tropical and subtropical environments indicates that ETo is especially sensitive to solar radiation and temperature, while humidity and wind speed often exert secondary, seasonally variable effects on model performance (Sabino and de Souza, 2023; Silva et al., 2018).
Sensor accuracy and data quality are also critical because uncertainty in radiation, humidity, and wind measurements can propagate directly into ETo estimates and irrigation recommendations (Moratiel et al., 2013; Abeysiriwardana et al., 2022). The Penman-Monteith equation is widely regarded as the benchmark for ETo estimation due to its comprehensive consideration of meteorological variables, but its accuracy can be compromised in regions with limited data availability (Ippolito et al., 2024). In addition, projected increases in ETo under changing climate scenarios reinforce the need for locally robust estimation procedures in water-limited production systems (Sabino et al., 2024).
In the foothill zone of the Colombian Orinoquia, where agricultural expansion demands simple tools to support irrigation management, local comparisons among ETo estimation methods are still needed. Studies conducted in tropical and subtropical environments have reported variable levels of agreement between the Class A pan and Penman-Monteith according to climate, pan coefficient and temporal aggregation scale (Owusu-Sekyere et al., 2017; Trajkovic and Stojnic, 2008). Selection of an appropriate pan coefficient (Kp) is critical because reported values can range from 0.60 to 0.85 depending on local conditions (Chen et al., 2005; Souza et al., 2015). The FAO-56 PM equation served as a benchmark for assessing the Kp models; however, the Kpan models demonstrated insufficient accuracy in estimating ETo at the monthly and seasonal scales. (Koç, 2022). Whereas 0.70 has frequently been used as an operational value in tropical environments when site-specific calibration is unavailable (Lopes et al., 2012).
The objective of this study was to compare ETo values obtained with Penman-Monteith and with a Class A evaporation pan during the 2016 and 2017 dry seasons in Yopal, Casanare, and to quantify the degree of agreement between both methods using statistics of error, association and bias. The working hypothesis was that, under local agrometeorological monitoring conditions, the Class A pan would adequately reproduce the temporal variation of ETo estimated by Penman-Monteith across both years.
2. Methodology
Study site and analysis period
The study used data recorded at the Utopía campus of Universidad de La Salle, located in Yopal, Casanare, Colombia (5°19′31″ N, 72°17′48″ W; 256 m a.s.l.), within the foothill zone of the Orinoquia. The updated analysis considered dry-season data from two independent years. For 2016, the analyzed period extended from 9 February to 6 March, whereas for 2017 it extended from 9 February to 13 March. The analytical dataset was restricted to paired dates with simultaneous ETo estimates by both methods, yielding 26 observations in 2016 and 26 in 2017, for a pooled total of 52 paired observations.
Reference evapotranspiration estimation
Penman-Monteith ETo was obtained from air temperature, relative humidity, wind speed and solar radiation records generated by a Davis WeatherLink meteorological station following the FAO-56 approach (Allen et al., 1998). For the Class A pan, ETo was calculated from observed pan evaporation using a fixed pan coefficient (Kp) of 0.70. This value lies within the range reported for tropical and subtropical conditions and represents a conservative operational estimate commonly adopted when detailed local calibration is unavailable (Chen et al., 2005; Souza et al., 2015; Lopes et al., 2012). In both methods, the unit of analysis was mm d⁻¹.
Statistical analysis
For each method, descriptive statistics were calculated (mean, standard deviation, coefficient of variation, minimum, maximum and accumulated Eto). Method comparison was first conducted for the pooled dataset and then separately for each year. Paired comparisons were evaluated using a paired t test and, the Wilcoxon signed-rank test. Agreement between methods was assessed with Pearson’s correlation coefficient (r), coefficient of determination (R²), mean absolute error (MAE), root mean square error (RMSE), mean bias error (MBE) and Willmott’s index of agreement (d) (Cabral Júnior et al., 2018). A simple linear regression was fitted to the pooled dataset for graphical interpretation of the relationship between methods. To charac-terize climatic differences between years, daily climatic variables were compared with Welch’s t test. As an exploratory analysis, Pearson correlations were computed between daily pan bias and selected climatic variables.
3. Results and discussion
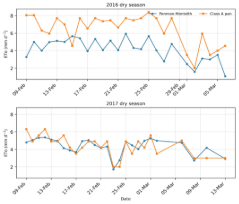
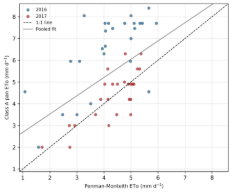
ETo exhibited contrasting interannual behavior between methods (Figure 1). In 2016, the Class A pan systematically produced larger estimates than Penman-Monteith throughout most of the dry-season period, whereas in 2017 both methods followed a markedly closer temporal trajectory. This difference in year-to-year behavior strongly affected the pooled comparison.
In descriptive terms, pooled mean ETo was 4.24 ± 1.10 mm d⁻¹ for Penman-Monteith and 5.40 ± 1.79 mm d⁻¹ for the Class A pan, with accumulated values of 220.34 and 281.02 mm, respectively (Table 1). The year-specific statistics show that the pooled divergence was driven mainly by 2016, when mean pan-based ETo reached 6.43 mm d⁻¹ compared with 4.13 mm d⁻¹ for Penman-Monteith. In contrast, 2017 showed near-equivalent mean values of 4.38 and 4.34 mm d⁻¹, respectively.
The paired comparison confirmed this contrast (Table 2). Across the pooled dataset, the mean bias of the Class A pan relative to Penman-Monteith was 1.17 mm d⁻¹, and the paired difference was statistically significant (paired t, p < 0.001; Wilcoxon, p < 0.001).
The year-specific contrast is consistent with the known sensitivity of pan-based estimates to local micrometeorological conditions and to the choice of Kp. The literature has repeatedly shown that Kp varies with wind regime, atmospheric dryness, fetch and exposure conditions (Chen et al., 2005; Cunha et al., 2013; Souza et al., 2015). Under this interpretation, the acceptable 2017 performance does not validate the universal use of Kp = 0.70 at the site; rather, it indicates that the selected coefficient was suitable under one seasonal dataset but not under another. The large positive bias in 2016 suggests that a fixed coefficient failed to capture interannual variability in the relationship between pan evaporation and reference-surface evapotranspiration.
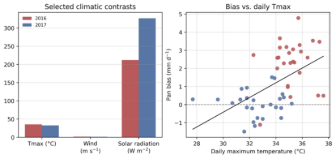
The ancillary climatic analysis presented in Table 3 and Figure 3 provides additional support for this interpretation. Relative to 2017, the 2016 study window was characterized by higher daily maximum temperature, higher minimum temperature, slightly higher wind speed and lower relative humidity, while also exhibiting lower mean daily solar radiation. The positive association of daily pan bias with maximum temperature and wind speed is consistent with broader sensitivity analyses showing that radiation, temperature, humidity and wind interact nonlinearly in Penman-Monteith-based ETo estimation, with solar radiation and atmospheric dryness exerting particularly strong influence in tropical environments (Sabino and de Souza, 2023; Moratiel et al., 2013). Solar radiation and maximum temperature are primary drivers of ETo in tropical and subtropical climates, with wind speed also playing a significant role in semi-arid regions (Moro et al., 2024).
The environmental contrast between years is therefore physically plausible rather than anomalous. Recent tropical studies indicate that solar radiation and temperature are commonly the dominant controls on ETo variability, whereas humidity and wind speed contribute secondary but seasonally variable effects, especially during dry periods and in regions with stronger aerodynamic demand (Silva et al., 2018; Sabino and de Souza, 2023). In this context, the 2016 overestimation likely reflects both the environmental sensitivity of free-water evaporation and the limitations of applying a temporally invariant Kp across contrasting seasonal windows. In Central America, Puerto Rico, ETo is most sensitive to relative humidity, followed by solar radiation and temperature, with wind speed having a lesser impact (Irizarry-Ortiz & Harmsen, 2023).
The 2016 and 2017 results should therefore be interpreted jointly rather than competitively. The 2017 agreement confirms that the Class A pan may provide useful operational estimates under certain conditions, whereas the 2016 overestimation demonstrates that such performance is condition dependent. Similar variability in method concordance has been reported in tropical and subtropical environments, where pan-based ETo may shift from acceptable to biased as atmospheric demand, humidity conditions or local exposure change (Owusu-Sekyere et al., 2017; Cabral Júnior et al., 2018). The pan evaporation paradox, characterized by a decrease in pan evaporation despite rising temperatures, highlights the complex interplay among factors such as solar radiation, wind speed, and relative humidity, which often counterbalance the effects of temperature increases (Wang et al., 2017).
A central implication is that local calibration should be treated as a priority rather than as refinement. Future work should estimate site-specific or season-specific Kp values and evaluate whether dynamic Kp formulations reduce the interannual error structure observed here. In addition, broader validation across wet and transition periods is needed because the present analysis remains restricted to dry-season windows. As noted by Lunardi et al. (1999) and Pereira (1998), multi-season evaluation and, where possible, comparison against lysimetric measurements would provide a stronger basis for operational adoption. This recommendation is reinforced by recent scenario-based studies indicating that ETo responses may intensify under future climatic variability, which further increases the value of locally calibrated estimation frameworks (Sabino et al., 2024).
The variability of environmental factors such as weather, soil, and crop types requires frequent model updates and validation to maintain their accuracy and reliability. In water delivery and crop yield forecasting, Hernández et al. (2025) noted that agricultural predictions will depend on integrated architectures that combine physical simulations, satellite data, and adaptive learning. Adding explainability and multicriteria assessment turns these predictive models into strategic tools for sustainable management, aligning technological performance with ecological and social considerations. Real-time remote sensing and weather data highlight the necessity for regular verification to match model outputs with field conditions (Dhakar et al., 2025). Economic and environmental pressures, including water scarcity and costly resources such as electricity and nitrogen, emphasize the need for models that optimize water efficiency and economic returns, requiring continuous model updating and validation.
In practical terms, the Class A pan remains valuable as a low-cost agrometeorological tool, but the updated evidence does not support its unconditional interchangeability with Penman-Monteith in Yopal. Its use for irrigation scheduling should therefore be accompanied by local calibration, periodic verification, and awareness that predictive accuracy may vary substantially between years.
4. Conclusions
Across the two dry seasons evaluated in Yopal, the Class A pan did not reproduce Penman–Monteith ETo with consistent accuracy when a fixed Kp of 0.70 was applied. Although the 2017 dataset showed close agreement between the two methods, the 2016 dataset revealed substantial overestimation by the pan, leading to a significant pooled bias and only moderate overall agreement.
The additional climatic characterization suggests that the divergence between methods was associated with environmental contrasts during the paired study periods, particularly higher maximum temperature and greater aerodynamic demand in 2016. These results indicate that pan performance at the site is environmentally sensitive rather than temporally stable.
Based on the pooled evidence, the Class A pan may still be useful for local agrometeorological monitoring; however, its application in irrigation scheduling should be supported by local calibration and validation across multiple seasonal periods.
Acknowledgements
The author thanks Universidad de La Salle for providing access to the experimental facilities at the Utopía campus and for the technical support associated with field data collection. Appreciation is also extended to Huber Chiquillo, agronomy engineering student, for assistance with data collection.
References
Allen, R. G., Pereira, L. S., Raes, D., & Smith, M. (1998). Crop evapotranspiration: Guidelines for computing crop water requirements. Food and Agriculture Organization of the United Nations.
Cabral Júnior, J. B., Lucena, R. L., & Almeida, H. A. (2018). Avaliação da evapotranspiração de referência diária, estimada pelo método tanque classe A, para Campina Grande, PB. Revista Brasileira de Geografia Física, 11(6), 1971–1984. https://doi.org/10.26848/rbgf.v11.6.p1971-1984
Cemek, B., Küçüktopçu, E., Fleitas Ortellado, M. G., & Simsek, H. (2025). Data-driven estimation of reference evapotranspiration in Paraguay from geographical and temporal predictors. Applied Sciences, 15(21), 11429.
Chen, D., Gao, G., Xu, C.-Y., Guo, J., & Ren, G. (2005). Comparison of the Thornthwaite method and pan data with the standard Penman-Monteith estimates of reference evapotranspiration in China. Climate Research, 28(2), 123–132. https://doi.org/10.3354/cr028123
Córdova, M., Carrillo-Rojas, G., Crespo, P., Wilcox, B., & Célleri, R. (2015). Evaluation of the Penman-Monteith (FAO 56 PM) method for calculating reference evapotranspiration using limited data. Mountain Research and Development, 35(3), 230–239. https://doi.org/10.1659/MRD-JOURNAL-D-14-0024.1
Cunha, P. C. R., Nascimento, J. L., Silveira, P. M., & Alves Júnior, J. (2013). Eficiência de métodos para o cálculo de coeficientes do tanque classe A na estimativa da evapotranspiração de referência. Pesquisa Agropecuária Tropical, 43(2), 114–122. https://doi.org/10.1590/S1983-40632013000200005
Dhakar, R., Sehgal, V. K., Chakraborty, D., Sahoo, R. N., Mukherjee, J., Ines, A. V. M., Kumar, S. N., Shirsath, P. B., & Roy, S. B. (2022). Field scale spatial wheat yield forecasting system under limited field data availability by integrating crop simulation model with weather forecast and satellite remote sensing. Agricultural Systems, 195, 103299. https://doi.org/10.1016/j.agsy.2021.103299
Elbeltagi, A., Nagy, A., Mohammed, S., Pande, C. B., Kumar, M., Bhat, S. A., ... & Juhász, C. (2022). Combination of limited meteorological data for predicting reference crop evapotranspiration using artificial neural network method. Agronomy, 12(2), 516.
Hernández Hernández, G. C., Gómez Gómez, J., & Jiménez-Cabas, J. (2025). Predictive models based on artificial intelligence to estimate crop yield: A literature review. Agriculture, 15(23), 2438. https://doi.org/10.3390/agriculture15232438
Ippolito, M., De Caro, D., Cannarozzo, M., Provenzano, G., & Ciraolo, G. (2024). Evaluation of daily crop reference evapotranspiration and sensitivity analysis of FAO Penman-Monteith equation using ERA5-Land reanalysis database in Sicily, Italy. Agricultural Water Management, 295, 108732.
Irizarry-Ortiz, M., & Harmsen, E. W. (2023). Sensitivity of the Penman–Monteith reference evapotranspiration equation to meteorological variables for Puerto Rico. Hydrology, 10(5), 101. https://doi.org/10.3390/hydrology10050101
Jensen, M. E., Burman, R. D., & Allen, R. G. (1990). Evapotranspiration and irrigation water requirements. American Society of Civil Engineers.
Koç, D. L. (2022). Assessment of pan coefficient models for the estimation of the reference evapotranspiration in a Mediterranean environment in Turkey. PeerJ, 10, e13554. https://doi.org/10.7717/peerj.13554
Lakhiar, I. A., Yan, H., Zhang, C., Zhang, J., Wang, G., Deng, S., Syed, T. N., Wang, B., & Zhou, R. (2024). A review of evapotranspiration estimation methods for climate-smart agriculture tools under a changing climate: Vulnerabilities, consequences, and implications. Journal of Water and Climate Change, 16, 249–288. https://doi.org/10.2166/wcc.2024.048
Lopes, A. S., Oliveira, G. Q., Lopes, L. H., & Pacheco, A. (2012). Avaliação do coeficiente do tanque classe A para estimativa da evapotranspiração de referência em Aquidauana-MS. Irriga, 1(1), 1–12. https://doi.org/10.15809/irriga.2012v1n01p01
Lunardi, M. A., Lunardi, D. M. C., & Cavaguti, N. (1999). Comparação entre medidas evapotranspirométricas e metodologia da FAO, na determinação da evapotranspiração de referência. Irriga, 4(1), 31–42. https://doi.org/10.15809/irriga.1999v4n1p31-42
Moratiel, R., Martínez-Cob, A., & Latorre, B. (2013). Variation in the estimations of ETo and crop water use due to the sensor accuracy of the meteorological variables. Natural Hazards and Earth System Sciences, 13(6), 1401–1410. https://doi.org/10.5194/nhess-13-1401-2013
Moro, I. P., Zanetti, S. S., Cecílio, R. A., Pezzopane, J. E. M., & Xavier, A. C. (2025). Influência dos elementos meteorológicos na evapotranspiração de referência diária. Revista Brasileira de Meteorologia, 40, e40240043. https://doi.org/10.1590/0102-778640240043
Nikolaou, G., Neocleous, D., Evangelides, E., & Kitta, E. (2025). A decision support system for irrigation scheduling using a reduced-size pan. Agronomy, 15(4), 848. https://doi.org/10.3390/agronomy15040848
Owusu-Sekyere, J. D., Ampofo, E. A., & Asamoah, O. (2017). Comparison of five different methods in estimating reference evapotranspiration in Cape Coast, Ghana. African Journal of Agricultural Research, 12(42), 3092–3102. https://doi.org/10.5897/AJAR2017.12594
Pereira, F. A. C. (1998). Desempenho do modelo de Penman-Monteith e de dois evaporímetros na estimativa da evapotranspiração de referência (ETo) em relação a um lisímetro de pesagem [Doctoral dissertation, Universidade de São Paulo]. https://doi.org/10.11606/T.11.2019.TDE-20191220-122609
Sabino, M., & de Souza, A. P. (2023). Global sensitivity of Penman-Monteith reference evapotranspiration to climatic variables in Mato Grosso, Brazil. Earth, 4(3), 714–727. https://doi.org/10.3390/earth4030038
Sabino, M., da Silva, A. C., de Almeida, F. T., & de Souza, A. P. (2024). Reference evapotranspiration in climate change scenarios in Mato Grosso, Brazil. Hydrology, 11(7), 91. https://doi.org/10.3390/hydrology11070091
Silva, G. H. D., Dias, S. H. B., Ferreira, L. B., Santos, J. E. O., & Cunha, F. F. (2018). Performance of different methods for reference evapotranspiration estimation in Jaíba, Brazil. Revista Brasileira de Engenharia Agricola e Ambiental, 22(2), 83–89. https://doi.org/10.1590/1807-1929/agriambi.v22n2p83-89
Souza, A. P., Almeida, F. T., Arantes, K. R., Martim, C. C., & Silva, J. O. (2015). Coeficientes de tanque Classe A para estimativa da evapotranspiração de referência diária na região de transição Cerrado-Amazônica. Scientia Plena, 11(5), 1–12.
Trajkovic, S., & Stojnic, V. (2008). Simple daily ET0 estimation techniques. Facta Universitatis: Architecture and Civil Engineering, 6(1), 117–125.
Valle Júnior, L. C. G. d., Vourlitis, G. L., Curado, L. F. A., Palácios, R. d. S., Nogueira, J. d. S., Lobo, F. d. A., Islam, A. R. M. T., & Rodrigues, T. R. (2021). Evaluation of FAO-56 procedures for estimating reference evapotranspiration using missing climatic data for a Brazilian tropical savanna. Water, 13(13), 1763. https://doi.org/10.3390/w13131763
Wang, T., Zhang, J., Sun, F., & Liu, W. (2017). Pan evaporation paradox and evaporative demand from the past to the future over China: A review. Wiley Interdisciplinary Reviews: Water, 4(3), e1207. https://doi.org/10.1002/wat2.1207