IoT sensors and dendrometer monitoring reveal differential irrigation requirements during arabica coffee phenological phases
Los sensores IoT y el monitoreo con dendrómetros revelan necesidades de riego diferenciales durante las fases fenológicas del café arábica
Jefferson Vasconcelos Oliveira De Lima1; André Luís Teixeira Fernandes2;
Eusímio Felisbino Fraga Júnior3; Pedro Otávio Honorato Da Cruz3;
João Pedro Honorato Da Cruz3; Márcio José De Santana2
1 Instituto de Ciências Agrárias, Universidade Federal de Uberlândia, Uberlândia, Minas Gerais, Brazil.
2 Instituto Federal de Educação Ciência e Tecnologia do Triângulo Mineiro, Uberaba, Minas Gerais, Brazil.
3 Instituto de Ciências Agrárias, Universidade Federal de Uberlândia, Monte Carmelo, Minas Gerais, Brazil.
ORCID de los autores
De Lima, J. V. O.: https://orcid.org/0009-0001-1939-8712 Fernandes A. L. T.: https://orcid.org/0000-0002-2727-3477
Fraga Júnior, E. F.: https://orcid.org/0000-0002-1721-9805 Cruz, P. O. H: https://orcid.org/0000-0002-1367-0770
Cruz, J. P. H: https://orcid.org/0000-0001-9713-2146 Santana, M. J.: https://orcid.org/0000-0003-1985-6880
ABSTRACT
A remote irrigation management system using Internet of Things (IoT) sensors was evaluated in arabica coffee (Coffea arabica L.) under drip irrigation in the Cerrado Mineiro region of Brazil. The study compared the GBI (Growth-Based Irrigation™) system, which integrates dendrometer and soil moisture sensors readings with meteorological data, to conventional climatic-based management. The experiment was conducted from August 2017 to May 2018 in a randomized complete block design with two treatments and twelve replicates. Evaluations were made during three phenological phases (flowering, small green, and graining) between September 2017 and May 2018. Biometric parameters, leaf water potential, grain yield, and maturation were assessed. No statistically significant differences were found between treatments in any evaluated variable (Tukey, p≤0.05). However, dendrometer readings showed greater and more continuous stem diameter expansion in the GBI system, and the sensor-based approach substantially reduced field labor requirements while enabling real-time automated irrigation control.
Keywords: soil moisture sensors; dendrometer; drip; coffee crop; irrigation.
RESUMEN
Se evaluó un sistema de gestión remota de riego mediante sensores de Internet de las Cosas (IoT) en cafetos arábica (Coffea arabica L.) bajo riego por goteo en la región del Cerrado Mineiro, Brasil. El estudio comparó el sistema GBI (Growth-Based Irrigation™), que integra lecturas de dendrómetros y sensores de humedad del suelo con datos meteorológicos, con la gestión convencional basada en el clima. El experimento se llevó a cabo de agosto de 2017 a mayo de 2018 en un diseño de bloques completos aleatorizados con dos tratamientos y doce repeticiones. Las evaluaciones se realizaron durante tres fases fenológicas (floración, grano pequeño y grano) entre septiembre de 2017 y mayo de 2018. Se evaluaron parámetros biométricos, potencial hídrico foliar, rendimiento de grano y maduración. No se encontraron diferencias estadísticamente significativas entre los tratamientos en ninguna de las variables evaluadas (Tukey, p≤0,05). Sin embargo, las lecturas de dendrómetros mostraron una expansión del diámetro del tallo mayor y más continua en el sistema GBI, y el enfoque basado en sensores redujo sustancialmente los requisitos de mano de obra en campo, al tiempo que permitió un control de riego automatizado en tiempo real.
Palabras clave: sensores de humedad del suelo; dendrómetro; goteo; cultivo de café; riego.
1. Introduction
Coffee (Coffea arabica L.) is a crop of major economic importance for Brazil. After an intense frost in 1975 at Paraná state in Brazil, the main producing areas shifted to regions with lower historical frost occurrence, with the Cerrados becoming one of the primary coffee-growing regions. The Cerrado Mineiro region currently accounts for approximately 10% of Brazil's coffee production, encompassing nearly 235 thousand hectares (CONAB, 2024). Coffee production in this region is characterized by productivity above the national average, achieved through efficient use of inputs, irrigation, improved genotypes, and mechanization (Silva et al., 2024).
Coffee originated in sub-forest environments and high altitudes, and in Brazil it suffers from biennial production patterns due to cultivation under full sun (Camargo & Camargo, 2001). Adequate irrigation management is one practice that can minimize this oscillation and supplement the seasonal water deficit common in the Cerrado region (Nguyen et al., 2023).
Knowledge of the coffee phenological cycle, particularly the critical water-demand periods during flowering, fruit development, and grain filling, is essential for precision irrigation prescription (Kobayashi et al., 2008). Current irrigation management methodologies rely primarily on soil monitoring through tensiometers and climatic monitoring using meteorological station data (Folegatti & Fernandes, 2013); however, these methods typically require manual field data collection and interpretation.
Advances in Internet of Things (IoT) technology have enabled real-time, automated irrigation management systems that integrate multiple sensor types and meteorological data (Mansoor et al., 2025). Recent reviews demonstrate the potential of IoT-based approaches to optimize water use efficiency in agriculture, though their effectiveness still requires validation through field research in specific cropping systems.
Dendrometer sensors, which continuously monitor stem diameter variations as an indicator of plant water status, represent a complementary tool to conventional indicators (Fereres & Goldhamer, 2003), potentially allowing more responsive irrigation scheduling. The GBI (Growth-Based Irrigation™) system exemplifies this approach by integrating dendrometer readings, soil moisture sensors at multiple depths, and meteorological data through automated algorithms (Dong et al., 2024) to determine irrigation timing and volume, while providing remote monitoring and control through web-based interfaces.
The aim of this study was to compare the operatio-nal performance and agronomic outcomes of the GBI remote management system versus conven-tional climatic-based irrigation management across three phenological phases of arabica coffee under drip irrigation, evaluating effects on biometric parameters, leaf water potential, grain yield, and fruit maturation in the Cerrado Mineiro region.
2. Methodology
2.1. Experiment location and climatic charac-teristics
This research was conducted between August 2017 and May 2018, at Vitória II Farm, in the municipality of Monte Carmelo, Minas Gerais, Brazil, under geographic coordinates 18°51'43.5" S and 47°21'10.5" W, at an elevation of 880 m. The local climatic is Köppen-Geiger Aw type (tropical humid with cold, dry winters). The average annual precipitation is 1,444 mm and mean annual temperature is 21.2°C.
2.2. Crop characteristics and experimental design
The coffee trees were Catuaí Amarelo variety, planted in 2010 at spacing of 3.80 × 0.60 m, with a stand of 4,386 plants ha⁻¹. Irrigation was applied through a single-line drip system with an average flow rate of 2.3 L h⁻¹, with emitters spaced 0.50 m apart. The experimental design was a randomized complete block design (RCBD) with two irrigation management treatments (GBI and climatic-based method), twelve blocks, and twenty-four experi-mental units. Each experimental unit consisted of two units on the same coffee row, spaced 10 m apart, with seven plants each. The total experi-mental area was 840 m² (382 m² in the 12 experimental blocks plus 456 m² spacing between plots).
2.3. Physical and hydric characteristics of the soil
Soil physical-water characteristics were determi-ned at the IAC/Campinas Soil Physics Laboratory: bulk density 1.22 g cm⁻³, field capacity 0.335 g g⁻¹, permanent wilting point 0.181 g g⁻¹, and effective root depth 40 cm. Irrigation uniformity was evalua-ted using the Christiansen Uniformity Coefficient (CUC); the GBI system achieved 92.13% efficiency with average flow of 2.53 L h⁻¹, and the climatic-based method achieved 94.57% with 2.54 L h⁻¹, both considered excellent uniformity.
2.4. Climatic-Based Management Method
For the climatic-based management method, the climatological water balance was calculated using the Penman-Monteith-FAO formula (Allen et al., 1998) with meteorological data from a Davis Vantage Pro2 weather station. Reference evapo-transpiration (ET₀) was calculated as equation 1:

Where ET0: reference evapotranspiration (mm d-1); Rn: balance of radiation to the crop surface (MJ m-2 d-1); G: density of soil heat flux (MJ m-2 d-1); T: air temperature at 2 m height (°C); u2: wind speed at 2 m high (m s-1); Es: saturation vapor pressure (kPa); Ea: partial vapor pressure (kPa); ∆: slope of the saturation vapor pressure curve (kPa°C-1); and γ: psychrometric coefficient (kPa°C-1).
The crop evapotranspiration (ETc) was calculated using equation 2:
ETc (field)= ETo.Kc.Ks (2)
Where ETc: crop evapotranspiration; ET0: reference evapotranspiration; Kc: Coefficient of the crop (Folegatti & Fernandes, 2013; Santinato et al., 2008); and, Ks: Coefficient of soil moisture soil water coefficient = 1.0 (Mantovani et al., 2015), justified because drip irrigation provides frequent water applications.
2.5. GBI (Growth-Based Irrigation™) Irrigation System
For the GBI (Growth-Based Irrigation™) system, a DE-1M dendrometer was installed on a coffee tree in the monitoring sector to continuously record stem diameter variations. Two MAS-1 analogue soil moisture sensors (4-20 mA output) were installed at 20 cm and 40 cm soil depths adjacent to the monitored plant. These three sensors were connected to an electronic control board that collected readings every hour and transmitted data via radio antennas to a Bermad BIC 2500 panel in the monitoring station.
Data was integrated on the Talgil web server with meteorological information through automated algorithms to determine irrigation timing and volume requirements. Identical sensors were installed in the climatic-based treatment units for comparison purposes.
2.6. Biometric evaluations
Biometric evaluations were performed on three plants per experimental unit with 12 biweekly measurements from September 2017 to February 2018, distributed across three phenological pha-ses: flowering (September–October, 4 measure-ments), small green fruit stage (November–December, 4 measurements), and grain-filling stage (January–February, 4 measurements). Measured biometric parameters included: (1) length growth of two plagiotropic branches per plant (sun-exposed and shaded sides) using a precision measuring tape, (2) number of productive nodes on these branches, and (3) stem diameter at 10 cm soil height using a digital caliper.
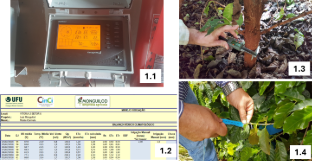
Figure 1. Davis Vantage Pro2 meteorological station panel (1.1), climatic management monitoring spreadsheet in Excel (1.2), coffee tree stem diameter measurement with digital caliper (1.3), and plagiotropic branch length measurement with precision measuring tape (1.4).
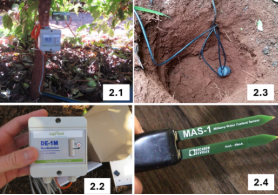
Figure 2. DE-1M dendrometer installed on monitored coffee tree stem (2.1), electronic control board for sensor data reception and transmission (2.2), MAS-1 soil moisture sensor installed at 20 cm soil depth (2.3), and detailed view of sensor (2.4).
2.7. Leaf water potential
Leaf water potential (ψ) was measured using a Scholander pressure chamber at the Water and Soil Engineering Laboratory of the Federal University of Uberlândia, Monte Carmelo Campus. Two leaves per plant were collected during pre-dawn hours (03:00–05:00) and measured accor-ding to phenological phases: one measurement each in September and October (flowering), November and December (small green), and January and February (grain-filling stage).
2.8. Harvesting and maturity assessment
At harvest, all fruits from six plants per experimental unit were collected (the first plant was discarded), and total fruit volume was measured in liters. Fruit maturity classification was assessed on a random 300 mL sample per experimental plot, with fruits classified into five maturity stages (cherry, raisin, dried, green, and green canas), then counted and weighed.
2.9. Statistical analysis
Data normality and homoscedasticity of variances were verified using the Shapiro-Wilk and Bartlett tests, respectively, using R Core Team 4.4.1. One-way ANOVA was conducted for each phenological phase, and treatment means were compared using Tukey’s HSD test at the 5% significance level (p ≤ 0.05).
3. Results and discussion
3.1. Water balance and comparison of treatments
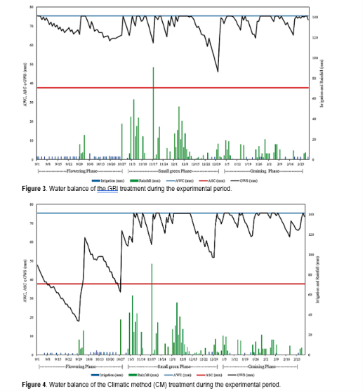
Both treatments were established in August 2017, with evaluations conducted between September 2017 and May 2018. During the flowering phase, the GBI treatment applied 104.41 mm of irrigation water (Figure 3), whereas the Climatic Method applied 50.11 mm, corresponding to less than half of the volume (Figure 4). During the small green stage, the high rainfall observed in November and December maintained adequate soil water storage in both treatments, reducing the need for irrigation. However, from mid-December onward, reduced rainfall required supplementary irrigation to restore soil water balance. In the graining phase, the GBI treatment again applied substantially higher irrigation depths, totaling 26.38 mm compared to 12.96 mm in the Climatic Method, especially during February (Table 1).
Considering cumulative irrigation across the three phenological phases, the GBI treatment applied 1.92 times more water than the Climatic Method. In the Climatic Method, ground water storage (GWS) remained below the actual storage capacity (ASC) only during September and late October. In contrast, the GBI treatment, maintained soil water balance consistently close to the ASC throughout the experimental period, reaching a minimum value of 45.98 mm on December 30th, 2017.
Table 1
Summary of precipitation (mm) and irrigation water volumes (mm) in the experimental period, presented in the water balance charts
Treatment | Item | Flowering | Small Green | Graining | Total |
Climatic method | Irrigation Sum (mm) | 50.11 | 9.91 | 12.96 | 72.98 |
Rainfall Sum (mm) | 87.00 | 685.90 | 226.00 | 998.90 |
Total (mm) | 137.11 | 695.81 | 238.96 | 1,071.88 |
GBI | Irrigation Sum (mm) | 104.41 | 9.07 | 26.38 | 139.87 |
Rainfall Sum (mm) | 87.00 | 685.90 | 226.00 | 998.90 |
Total (mm) | 191.41 | 694.97 | 252.38 | 1,138.77 |
3.2. Soil Moisture sensor readings
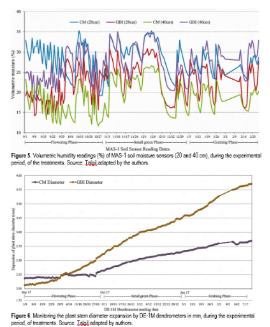
The MAS-1 soil moisture sensors installed at 20 and 40 cm depth showed patterns consistent with the water balance data (Figure 5), demonstrating their potential for irrigation management in coffee crops. However, recent studies emphasize that their accuracy and efficiency strongly depend on proper site-specific calibration, particularly considering soil texture and mineralogy (Abdelmoneim et al., 2025). When adequately calibrated, these sensors may contribute to significant water savings in irrigation systems.
3.3. Dendrometer readings
The DE-1M dendrometer detected greater stem expansion in the GBI treatment, increasing from 2.06 mm in Sept 2017 to 3.85 mm in Feb 2018, whereas the Climatic method showed a smaller increase, from 2.16 to 2.85 mm (Figure 6). These results suggest that greater water availability promotes higher stem growth. Recent studies also highlight the high sensitivity of dendrometers for monitoring plant water status and detecting water stress earlier than conventional field assessments (Waldburger et al., 2025; Blanco et al., 2023).
3.4. Evapotranspiration
The association of the readings of these sensors to the meteorological information, can be very important for a more effective direction in the irrigation management. In this study, both opera-tions used the information provided by Davis Vanta-ge Pro2 meteorological station, which enabled the calculation of ET₀ (reference evapotranspiration), figure 7, and consequently of ETC (crop evapotrans-piration), same as Costa et al (2023).
3.5. Biometric evaluations and leaf water potential
No statistically significant differences were obser-ved between treatments for productive nodes, plagiotropic branch growth, stem diameter, or leaf water potential across the evaluated phenological phases (Table 2). However, dendrometer monito-ring indicated greater stem expansion in the GBI treatment compared to the Climatic method, suggesting that the higher water supply during flowering may have favored vegetative develop-ment in subsequent stages.
In addition, dendrometers proved more sensitive than digital calipers due to their continuous monitoring capability. According to Schwan et al. (2020), maintaining stable plant water status is essential for sustaining vegetative growth and future coffee yield potential.
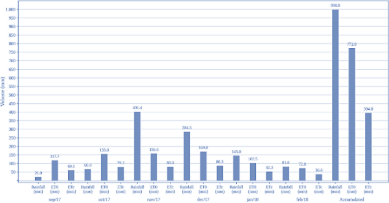
Figure 7. Monthly and accumulated ET₀ totals (reference evapotranspiration in mm), ETC (crop evapotranspiration in mm) and precipitation (mm), obtained by Davis Vantage Pro2 meteorological station in the evaluation period. Source: Talgil adapted by authors.
Table 2
Biometric assessments and leaf water potential for averages observed in the three phenological phases evaluated
Phenological Phase | Treatment | Number of productive nodes (u) | Length of branches (cm) | Plants’ Diameter (mm) | Water Potential in the leaves (MPa) |
Flowering | GBI | 2.07 a | 3.13 a | 54.41 a | -1.96 a |
Climatic method | 1.94 a | 2.94 a | 54.71 a | -1.72 a |
Small green | GBI | 3.47 a | 6.39 a | 54.57 a | -1.16 a |
Climatic method | 3.44 a | 6.45 a | 54.70 a | -1.15 a |
Graining | GBI | 4.43 a | 8.41 a | 55.76 a | -0.69 a |
Climatic method | 4.45 a | 8.53 a | 55.62 a | -0.67 a |
CV (%) | | 5.45 | 4.12 | 3.88 | 6.12 |
SW (p) | | 0.20 | 0.18 | 0.24 | 0.21 |
BT (p) | | 0.81 | 0.65 | 0.44 | 0.74 |
Means followed by the same letter in the column (phenological phase, do not differ, by Tukey test at 5% probability. CV (%): coefficient of variation; SW (p): Shapiro-Wilk test for normality; BT (p): Bartlett test for homoscedasticity.
3.6. Production and grains maturation
For productivity, data showed that the climatic method presented numerically superior averages, with 12.26 L plant⁻¹ and an estimated productivity of 6,720 kg ha⁻¹, while the GBI presented 11.72 L plant⁻¹ and 6,426 kg ha⁻¹ (Table 3). However, the averages did not differ statistically by Tukey's test at 5%, demonstrating that the increase in water applied in the GBI did not result in a proportional increase in productivity.
Although no statistical differences in productivity were observed between the treatments, the climate method showed greater water efficiency, producing similar values with a lower irrigated volume. For Martins et al. (2007), this behavior reinforces that higher irrigation depths do not always result in increased productivity, since "deficit or excess irrigation can lead to loss of productivity and reduced profitability."
On the maturation evaluations of coffee beans harvested in the plants, no statistical differences between the treatments were observed for the Cherry and Raisins/Drieds maturation categories (Table 4), both in grain mass (g) and in the number of grains (units). The exception was the Green/Green Canas category, where the GBI treatment showed significantly higher grain mass and number of grains than the Climatic method (p ≤ 0.05), suggesting that higher water availability during grain filling may have delayed fruit maturation, increasing the proportion of immature fruits.
Table 3
Evaluations of fruit production, for observed averages
Treatment | Fruit production (L plant-1) | Estimated Harvest* (kg ha-1) |
GBI | 11.72 a | 6426 a |
Climatic method | 12.26 a | 6720 a |
CV (%) | 8.74 |
SW (p) | 0.21 |
BT (p) | 0.58 |
Means followed by the same letter in the column (phenological phase, do not differ, by Tukey test at 5% probability. CV (%): coefficient of variation; SW (p): Shapiro-Wilk test for normality; BT (p): Bartlett test for homoscedasticity.
Estimated harvest*: (litter per plant) x (4286 plants/hectare). The standard yield is usually 480 liters per 60 kg bag, converted to 8 liters of coffee fruits = 1 kg of processed coffee.
Table 4
Maturation degrees and percentage of the coffee beans mass by harvested plants
Maturation Degree | Variable | Treatments |
Climatic method | GBI |
Cherry | Grain Mass (g) | 412,50 a | 398,50 a |
Number of grains (u) | 353,16 a | 365,00 a |
% Grain Mass (g) | 72,2% | 70,4% |
Mass / Grains | 1,17 | 1,09 |
Green / Green Canas | Grain Mass (g) | 58,08 b | 68,00 a |
Number of grains (u) | 54,66 b | 55,50 a |
% Grain Mass (g) | 10,2% | 12,0% |
Mass / Grains | 1,06 | 1,23 |
Raisins / Drieds | Grain Mass (g) | 100,58 a | 99,50 a |
Number of grains (u) | 185,58 a | 185,42 a |
% Grain Mass (g) | 17,6% | 17,6% |
Mass / Grains | 0,54 | 0,54 |
Total | Grain Mass (g) | 571,16 a | 566,00 a |
Number of grains (u) | 593,40 a | 605,92 a |
% Grain Mass (g) | 100,0% | 100,0% |
Mass / Grains | 0,96 | 0,93 |
CV (%) | Grain Mass (g) | 7,85 | 6,15 |
Number of grains (u) | 8,12 | 7,45 |
SW (p) | | 0,18 | 0,20 |
BT (p) | | 0,45 | 0,52 |
Means followed by the same letter in the column (phenological phase, do not differ, by Tukey test at 5% probability. CV (%): coefficient of variation; SW (p): Shapiro-Wilk test for normality; BT (p): Bartlett test for homoscedasticity.
Kobayashi et al. (2008) and Godinho et al. (2023) reported that uniform maturation in irrigated coffee is highly dependent on precise water management during the grain-filling stage, since excessive irrigation may disrupt the physiological signals associated with ripening. In the present study, although the GBI treatment applied 1.92 times more water than the Climatic method (139.87 mm vs. 72.98 mm), this additional water volume did not result in proportional gains in productivity or maturation uniformity.
Moreover, the Climatic method presented a higher mass-to-grain ratio, indicating superior grain filling efficiency. This response may be associated with better flowering synchronization promoted by moderate water restriction during the pre-flowering period, as proposed by Guerra et al. (2005). According to Camargo & Camargo (2001), coffee development depends on a balanced interaction between vegetative growth and reproductive stimuli, reinforcing the importance of precise irrigation management under conditions of high atmospheric demand.
Although IoT-based monitoring improved opera-tional management, the long-term agronomic benefits of applying substantially higher irrigation depths still require further investigation due to the biennial behavior of coffee plants.
3.7. Correlations
Ending this study, the Pearson correlation analysis (r) integrates field data with physiological responses, revealing three fundamental pillars regarding the efficiency of the evaluated irrigation systems (Table 5).
Water Use Efficiency (WUE) was defined as the ratio between the commercial coffee yield (kg ha-1) and the total water depth received by the crop (mm), including both irrigation and precipitation, expressed in kg ha-1 mm-1, as equation 3:
WUE =Y/TWA (3)
Where WUE: Water Use Efficiency (kg ha-1 mm-1); Y: Agricultural Yield (kg ha-1) of processed coffee; TWA: Total Water Applied (mm), representing the sum of irrigation depth and effective rainfall during the experimental period.
The Pearson correlation analysis revealed a strong negative association between total irrigation depth and Water Use Efficiency (WUE) (r = -0.96), indicating that the additional water applied in the GBI treatment was not converted into proportional yield gains. In contrast, excessive irrigation was positively correlated with the percentage of green fruits (r = 0.88), suggesting delayed fruit maturation under higher water availability. The negative correlation between leaf water potential (Ψw) and green fruits (r = -0.81) reinforces the influence of plant water status on ripening dynamics.
In addition, the strong positive correlation between nodes/branches and productivity (r = 0.85) confirms the importance of vegetative vigor for coffee yield. Although both treatments showed similar biometric responses, the Climatic Method achieved slightly higher productivity associated with greater WUE (r = 0.88), demonstrating that precise irrigation management may optimize yield while reducing water application.
4. Conclusions
IoT-based tools (soil moisture sensors and dendrometers) improved irrigation monitoring and operational management in coffee cultivation, though proper site-specific calibration remains essential.
No statistical differences were observed between treatments for biometric variables, leaf water potential, or productivity; however, the Climatic Method achieved similar yields with lower irrigation depth, resulting in greater water use efficiency and more uniform fruit maturation.
These results demonstrate that, under the conditions of this study, irrigation timing and decision-support strategies were more important than increasing total water supply.
Table 5
Pearson correlation matrix (r) between water, biometric, physiological, and yield variables
Variables | Total Irrigation | Nodes/Branches | Leaf Ψw | % Green | Yield | WUE |
Total Irrigation | 1 | -0.12 ns | -0.74* | 0.88* | -0.42 ns | -0.96* |
Nodes/Branches | - | 1 | 0.35 ns | -0.15 ns | 0.85* | 0.33 ns |
Leaf Ψw | - | - | 1 | -0.81* | 0.72* | 0.68* |
% Green | - | - | - | 1 | -0.55* | -0.78* |
Yield | - | - | - | - | 1 | 0.88* |
WUE | | - | - | - | - | 1 |
***Significant at 5%; Highly significant at 1% probability; ns: non-significant. WUE: Water Use Efficiency. Ψw: Leaf Water Potential.
Although IoT-based irrigation management impro-ved operational monitoring and automation, the higher irrigation depth applied by the GBI system did not translate into yield gains, highlighting the importance of calibration and decision-support algorithms for maximizing water use efficiency in precision coffee irrigation.
References
Abdelmoneim, A. A., Al Kalaany, C. M., Khadra, R., Derardja, B., & Dragonetti, G. (2025). Calibration of low-cost capacitive soil moisture sensors for irrigation management applications. Sensors, 25(1), 343. https://doi.org/10.3390/s25010343
Allen, R. G., Pereira, L.S., Raes, D., Smith, M. (1998). Crop evapotranspiration: Guidelines for computing crop water requirements (FAO Irrigation and Drainage Paper, 56). FAO.
Blanco, V., Bolivar-Medina, J. L., Casagrande-Biasuz, E., Willsea, N., & Kalcsits, L. (2023). Assessing water stress in a high-density apple orchard using trunk circumference variation, sap flow index and stem water potential. Frontiers in Plant Science, 14, 1230155. https://doi.org/10.3389/fpls.2023.1230155
Camargo, A. P., & Camargo, M. B. P. (2001). Definição e esquematização das fases fenológicas do cafeeiro arábica nas condições tropicais do Brasil. Bragantia, 60(1), 65–68.
Costa, T. S., Filgueiras, R., dos Santos, R. A., Cunha, F. F. (2023). Actual evapotranspiration by machine learning and remote sensing without the thermal spectrum. PLoS ONE, 18(5), e0285535. https://doi.org/10.1371/journal.pone.0285535
Fereres, E., & Goldhamer, D. (2003). Suitability of stem diameter variation and water potential as indicator for irrigation scheduling of almond trees. Journal of Horticultural Science and Biotechnology, 78(2), 139–144.
Folegatti, M. V., & Fernandes, A. L. T. (2013). Irrigação do Cafeeiro: Quando, quanto e por que se deve utilizar? Visão Agrícola, 12, 65–68.
Godinho, E. Z., Caneppele, F. L., Gabriel Filho, L. R. A., & Gabriel, C. P. C. (2023). Fuzzy modeling of coffee productivity under different irrigation depths, water deficit and temperature. Revista Brasileira de Engenharia de Biossistemas, 17, 1193. https://doi.org/10.18011/bioeng.2023.v17.1193
Guerra, A. F., Rocha, O. C., Rodrigues, G. C., Sanzonowicz, C., & Ribeiro, L. S. (2005). Manejo da irrigação do cafeeiro visando a sincronização da florada e sua influência na produtividade e qualidade do café. Revista Brasileira de Engenharia Agrícola e Ambiental, 9 (Suplemento), 212–215.
Kobayashi, E. S., Sakai, E., Silva, E. A., Arruda, F. B., Silveira, J. M. C., Souza, P. S., & Pires, R. C. M. (2008). Variação sazonal do potencial da água nas folhas de cafeeiro em Mococa-SP. Bragantia, 67(2), 421–428.
Mantovani, E. C., Bernardo, S., & Palaretti, L. F. (2015). Irrigação, princípios e métodos (3. ed.). Editora UFV.
Mansoor, S., Iqbal, S., Popescu, S. M., Kim, S. L., Chung, Y. S., & Baek, J. -H. (2025). Integration of smart sensors and IoT in precision agriculture: Trends, challenges and future prospectives. Frontiers in Plant Science, 16, 1587869. https://doi.org/10.3389/fpls.2025.1587869
Nguyen, K. T., Craparo, A., Nguyen, P. M., Turreira-García, N., Talsma, T., Deniau, A., Bossolasco, L., Le, T. D., & Bosselmann, A.S. (2023). ThIRST: Targeted Irrigation Support Tool for sustainable coffee production. Frontiers in Sustainable Food Systems, 7, 1267388. https://doi.org/10.3389/fsufs.2023.1267388
Santinato, R., Fernandes, A. L. T., & Fernandes, D. R. (2008). Irrigação na cultura do café (2. ed.). O Lutador.
Silva, P. C., Joaquim, M. S., Ramos, M. L. G., Ribeiro Junior, W. Q., & Veiga, A. D. (2024). Economic viability of irrigated coffee with different water regimes in the Cerrado. Revista de Economia e Sociologia Rural, 62(4), e283067. https://doi.org/10.1590/1806-9479.2023.283067
Schwan, M. G., Oliveira, P. H. S., Costa, G. M. A. V., Oliveira, A. Q., Pereira, L. R., & Reis, E. F. (2020). Yield of conilon coffee under different irrigation managements. Irriga, 25(4), 704–712. https://doi.org/10.15809/irriga.2020v25n4p704-712
Waldburger, T., Cockburn, M., Anken, T., Walter, A., Hatt, M., & Chiang, C. (2025). Dendrometer as a water stress indicator for apple trees. Agricultural Water Management, 309, 109326. https://doi.org/10.1016/j.agwat.2025.109326