Physicochemical and sensory characteristics of ferrous sulfate and ferric pyrophosphate for fresh cheese fortification
Características fisicoquímicas y sensoriales del sulfato ferroso y el pirofosfato férrico para la fortificación de queso fresco
Gina Mendoza1; Karina Eduardo1; Juan D. Rios-Mera2; Nils Leander Huamán-Castilla3;
Erick Saldaña1*
1 Sensory Analysis and Consumers Study Group, Escuela Profesional de Ingeniería Agroindustrial, Universidad Nacional de Moquegua, Prolongación Calle Ancash s/n, Moquegua 18001, Peru.
2 Grupo de Investigación en Reformulación de Alimentos (GIRA), Instituto de Investigación de Ciencia y Tecnología de Alimentos (ICTA), Universidad Nacional de Jaén, Carretera Jaén-San Ignacio, km 24-Sector Yanuyacu, Jaén 06800, Peru.
3 Laboratorio de Tecnologías Sustentables para la Extracción de Compuestos de Alto Valor, Instituto de Investigación para el Desarrollo del Perú (IINDEP), Universidad Nacional de Moquegua, Moquegua 18001, Peru.
ORCID de los autores
G. Mendoza: https://orcid.org/0009-0002-3222-0342 K. Eduardo: https://orcid.org/0009-0009-0102-9343
J. D. Rios-Mera: https://orcid.org/0000-0002-6769-767X N. L. Huamán-Castilla: https://orcid.org/0000-0002-3748-0883
E. Saldaña: https://orcid.org/0000-0002-4018-2852
ABSTRACT
This study evaluated the effects of adding microencapsulated ferrous sulfate (MFS) and ferric pyrophosphate (FPP) to a fresh cheese product. Five treatments were manufactured: a control (CTRL) and cheeses fortified with MFS or FPP at 90 mg Fe/kg (MFS1, FPP1) and 300 mg Fe/kg (MFS2, FPP2). The physicochemical characteristics (dry matter, moisture, mineral content, and color) and sensory profiles were analyzed. Results indicated that fortification decreased moisture content and increased dry matter. The MFS2 treatment showed the highest iron content (225.05 mg/kg) without compromising calcium levels. Significant color changes were observed only in the a* (redness) component of the FPP2 treatment. Sensory analysis revealed that the CTRL and FPP2 treatments were most liked, while the MFS2 treatment was least liked due to a pronounced metallic and rancid flavor. In conclusion, the type and concentration of the iron compound significantly influenced the cheese's final characteristics, whereas storage time had a minimal effect. FPP is a more suitable fortificant than MFS for maintaining the sensory quality of fresh cheese.
Keywords: fresh cheese; anemia; iron fortification; physicochemical characteristics; sensory evaluation.
RESUMEN
Este estudio evaluó los efectos de la adición de sulfato ferroso microencapsulado (MFS) y pirofosfato férrico (FPP) a un queso fresco. Se elaboraron cinco tipos de queso: un grupo control (CTRL) y quesos enriquecidos con MFS o FPP a concentraciones de 90 mg Fe/kg (MFS1, FPP1) y 300 mg Fe/kg (MFS2, FPP2). Se analizaron las características fisicoquímicas (materia seca, humedad, contenido mineral y color) y el perfil sensorial. Los resultados indicaron que el enriquecimiento disminuyó la humedad y aumentó la materia seca. El tratamiento MFS2 presentó el mayor contenido de hierro (225,05 mg/kg) sin afectar los niveles de calcio. Se observaron cambios significativos en el color solo en el parámetro a* (rojos) del tratamiento FPP2. El análisis sensorial reveló que los quesos de los grupos CTRL y FPP2 fueron los más apreciados, mientras que el queso del grupo MFS2 fue el menos apreciado debido a un sabor metálico y rancio pronunciado. En conclusión, el tipo y la concentración del compuesto de hierro influyeron significativamente en las características finales del queso, mientras que el tiempo de almacenamiento tuvo un efecto mínimo. El FPP es un agente de enriquecimiento más adecuado que el MFS para mantener la calidad sensorial del queso fresco.
Palabras clave: queso fresco; anemia; fortificación con hierro; características fisicoquímicas; evaluación sensorial.
1. Introduction
Iron deficiency anemia is among the most significant micronutrient deficiencies worldwide, affecting over 2 billion people, with higher rates in developing countries (WHO, 2023). In Peru, in 2023, 43.1% of children aged 6 to 35 months were affected by anemia (INEI, Peru, 2024).
In response to this issue, iron fortification of foods is a viable option. Dairy products, particularly cheese, are widely consumed foods with high nutritional value, making them potential vehicles for iron fortification programs. However, milk has a naturally low iron content, with only 0.2 mg/kg (Gaucheron, 2000), making its fortification necessary. Although iron is an essential micronutrient for multiple metabolic processes, its direct incorporation into foods can generate adverse effects on sensory perception (Dehnad et al., 2024; Muñoz-More et al., 2023). This is a common concern in iron fortification processes, as its addition can produce undesirable flavors, colors, and odors, such as metallic flavors, rancid flavors associated with induced lipid oxidation, and brownish discolorations (Boccio and Monteiro, 2004). Given the need to fortify cheese as a strategy to combat iron deficiency, the challenge arises of minimizing these negative sensory impacts.
Ferrous sulfate is a compound used for iron supplementation, recognized for its high bioavailability and low cost. However, adding it to food matrices, such as cheese, can present challenges, especially in terms of stability. Factors such as pH, moisture levels, oxidizing agents, and interactions with other milk components can damage its chemical structure. These changes not only reduce its effectiveness as an iron source but can also alter the sensory qualities of the final product. Specifically, the interaction of iron with lipids and moisture can lead to changes in flavor, color, or texture, which in turn impact consumer acceptance (INACG 2021; Mallqui Salas, 2021). To address this, microencapsulation is a useful technology for protecting sensitive compounds, such as iron, when added to foods (Xu et al., 2024). It guards against deterioration caused by oxygen, pH, or temperature, minimizes unwanted chemical reactions, and preserves the flavor, color, and other characteristics of the food (Muñoz-More et al., 2023). Microencapsulated ferrous sulfate has emerged as a promising option for food fortification, particularly in combating iron deficiency, which is among the most prevalent nutritional deficiencies worldwide (Hurrell, 2009).
Ferric pyrophosphate is another commonly used iron source in food fortification due to its chemical stability and low reactivity, making it particularly suitable for delicate products such as dairy. Unlike other ferrous salts, this ferric form does not cause strong metallic flavors or significantly change the color or texture of the food. However, its bioavailability is relatively low, which challenges its nutritional effectiveness (Allen et al., 2006). The comparison between ferrous sulfate and ferric pyrophosphate in cheese fortification has been studied in feta cheese by Jalili et al. (2017), who found that microencapsulation of ferrous sulfate effectively reduces metallic flavor compared to ferric pyrophosphate without encapsulation. Nonetheless, the comparison at the consumer level, sensory acceptability, and the incorporation of these compounds into fresh cheese (a popular product in Peru) have not been explored.
Therefore, this study aims to evaluate the impact of adding microencapsulated ferrous sulfate and ferric pyrophosphate on the moisture content, mineral composition, instrumental color, and sensory characteristics of fresh cheese.
2. Methodology
2.1 Fresh cheese manufacture
The physicochemical properties of raw milk were first analyzed. The milk was subsequently pasteurized at 65 °C for 30 min and divided equally among five treatment vats. A factorial design was employed, using two iron sources: microencapsulated ferrous sulfate (MFS) and ferric pyrophosphate (FPP), at two concentrations (90 or 300 mg Fe/kg), along with a control treatment without added iron (CTRL), resulting in a total of five treatments. Calcium chloride (18%) and commercial rennet (Chymoxin 1% CHR Hansen, Barnstaple, UK) were added to each vat, and the milk was allowed to coagulate at 35 °C for 30 minutes. The resulting curd was cut into approximately 1 cm pieces, left to stand for 5 minutes, and stirred for 30 min to drain the whey.
After weighing the curd, commercial salt (2.50% of curd weight) was manually mixed into it for 10 minutes. For the fortified treatments, the corresponding MFS or FPP compounds (Dr. Paul Lohmann GmbH & Co. KGaA, Emmerthal, Germany) were added to achieve the target iron concentrations, while the CTRL cheese received only salt. The curds were then placed into stainless steel molds, pressed for 20 and 40 minutes, vacuum-packed, and stored at 4 °C with limited light exposure (< 50 lux) for subsequent analysis.
2.2 Physicochemical characteristics of fresh cheese
Dry matter and moisture content
The dry matter content of the cheese samples was determined gravimetrically following the ISO 5534:2004 standard. Approximately 3 g of each crushed cheese sample was weighed into a capsule containing sea sand and a glass rod. The capsules were then dried in a forced-air oven at 102°C for 24 h. After drying, the capsules were cooled to room temperature in a desiccator and weighed again. Dry matter was calculated as the percentage of weight remaining. Moisture content (%) was subsequently calculated by difference from the dry matter.
Instrumental color
The instrumental color was measured using a colorimeter (Konica Minolta, model CR-20, Osaka, Japan). The colorimeter was calibrated against a white standard tile before measurements. The CIE-Lab color coordinates (L*, for lightness, a*, for redness, and b*, for yellowness) were recorded for each cheese sample under a D65 standard illuminant. The methodology followed the proce-dure described by Vargas-Uscategui et al. (2017).
Iron and calcium content
The iron and calcium content of the fresh cheese samples was quantified using a 55B AA Atomic Absorption Spectrophotometer (AAS; Agilent Technologies, Santa Clara, CA, USA) following sample digestion. For the digestion, one gram of fresh cheese was weighed into a pressurized digestion tube and pre-digested with 8 mL of 65% HNO₃ (Sigma-Aldrich, St. Louis, MO, USA) for 2 hours. The samples were then fully digested in a Multiwave 3000 microwave system (Anton Paar, Graz, Austria) at 600 W power and 160°C, reaching a pressure of 1,300 kPa with a 30-minute ramp time and a 10-minute hold time. After cooling, 2 mL of 30% H₂O₂ (Merck, Darmstadt, Germany) was added to each digestate, and the final volume was adjusted to 25 mL with Type 1 distilled water (18.2 MΩ·cm). All measurements were performed using an air-acetylene flame for sample atomization. Element-specific hollow cathode lamps were operated at wavelengths of 248.3 nm for iron and 422.7 nm for calcium. For iron analysis, the digested solution was used directly. For calcium analysis, a 3 mL aliquot of the digestate was diluted to a 25 mL volume containing 3 mL of a 10% (w/v) lanthanum chloride (LaCl₃) solution as a releasing agent. Analyte quantification was based on external calibration curves prepared from a 1000 mg/L stock solution (Certipur®, Merck), which exhibited excellent linearity (R² > 0.998). The method's accuracy and precision were confirmed by analyzing a certified reference material for every 15 samples.
2.3 Sensory characterization
Consumers
Fifty-eight consumers, aged 18 to 52, participated in this study. Recruitment took place at the National University of Moquegua. The inclusion criteria included participants who consumed fresh cheese at least once a week, as well as their interest and availability to participate in the study. The sensory ballot was printed on A4 bond paper, using intensity scales.
Procedure
The iron and calcium content of the fresh cheese samples were measured using a 55B AA Atomic Absorption Spectrophotometer (AAS; Agilent Technologies, Santa Clara, CA, USA) following sample digestion. For digestion, one gram of fresh cheese was weighed into a pressurized digestion tube and pre-digested with 8 mL of 65% HNO₃ (Sigma-Aldrich, St. Louis, MO, USA) for 2 hours. The samples were then fully digested in a Multiwave 3000 microwave system (Anton Paar, Graz, Austria) at 600 W and 160°C, reaching a pressure of 1,300 kPa with a 30-minute ramp and a 10-minute hold. After cooling, 2 mL of 30% H₂O₂ (Merck, Darmstadt, Germany) was added to each digest, and the final volume was adjusted to 25 mL with Type 1 distilled water (18.2 MΩ·cm).
All measurements were performed using an air-acetylene flame for sample atomization. Element-specific hollow cathode lamps were operated at wavelengths of 248.3 nm for iron and 422.7 nm for calcium. For iron analysis, the digested solution was used directly. For calcium analysis, a 3 mL aliquot of the digestate was diluted to a 25 mL volume containing 3 mL of a 10% (w/v) lanthanum chloride (LaCl₃) solution as a releasing agent. Analyte quantification was based on external calibration curves prepared from a 1000 mg/L stock solution (Certipur®, Merck), which exhibited excellent linearity (R² > 0.998). The method's accuracy and precision were confirmed by analyzing a certified reference material for every 15 samples.
2.4 Data analysis
For the analysis of instrumental data, a Rando-mized Complete Block Design (RCBD) with a 5 × 3 factorial arrangement was employed. The fixed factors were treatment (CTRL, MFS1, MFS2, FPP1, FPP2) and storage time (1, 3, and 6 days), while the cheese process was considered a random effect (block). The data were analyzed using generalized linear mixed models (PROC GLIMMIX in SAS 9.4). Since the treatment × time interaction was not significant (p > 0.05) for any of the instrumental responses, the analysis focused on the treatment factor; when significant, the Tukey-Kramer comparison test was applied (α = 0.05).
For sensory data, assessed only on day 6, statistical analysis focused on the fixed effect of treatment within the same block design. A mixed model and the Tukey-Kramer test were used to identify significant differences in attribute acceptability and intensity. Additionally, a Principal Components Analysis (PCA) was performed using XLSTAT software to visualize the relationships between sensory attributes, acceptability, and treatments. All statistical analyses were conducted at a 5% significance level, after verifying the assumptions of normality and homogeneity of variance.
3. Results and discussion
3.1 Dry matter and moisture content
The addition of iron compounds significantly influenced the dry matter and moisture content of the fresh cheese (p < 0.05), as shown in Table 1. Storage time and the treatment-time interaction had no significant effects. The MFS2 treatment (300 mg Fe/kg) produced the highest dry matter content, which was 3.1% higher than the CTRL group. Similarly, the MFS2 cheese had the lowest moisture content. The MFS1, FPP1, and FPP2 treatments displayed intermediate values with no significant differences among them.
These findings align with previous reports, which show that iron fortification reduces moisture in various types of cheese (Quicaño Huaman & Moreno Casavilca, 2023; Siddique & Park, 2019). This effect is attributed to the role of iron salts as structuring agents. Milk proteins, especially caseins, contain phosphoserine residues that carry a net negative charge, which promotes repulsion and dispersion (Smialowska, 2017). The Fe³⁺ ions introduced from FPP, or any released Fe²⁺ from MFS, bind to these negatively charged groups, neutralizing the charge and decreasing electrostatic repulsion. This allows the protein network to become more compact and dense, enhancing whey drainage during coagulation and increasing dry matter content. Although MFS is designed to protect the iron, some ferrous iron (Fe²⁺) may have been released during salting and pressing, enabling it to interact with the proteins (Chang et al., 2016).
3.2 Instrumental color
Among the measured color parameters (Table 2), only the a* value was significantly influenced by the iron treatment (p < 0.05). The FPP2 treatment resulted in a significant decrease in the a* value compared to the CTRL treatment, suggesting a less reddish and more desirable white appearance for the cheese. The L* (lightness) and b* (yellowness) values were not significantly affected by iron type, concentration, or storage time.
The lack of significant color changes in the MFS treatments suggests that the microcapsule provided an effective barrier against iron-food component interactions, which is consistent with findings by Nabeshima et al. (2005). The fortified breads in their study did not differ significantly from the control.
Table 1
Dry matter and moisture content of fresh cheese according to treatment and day of evaluation
Response | Treatments1 |
Day | CTRL | MFS1 | FPP1 | MFS2 | FPP2 |
Dry matter (%) | 1 | 39.19±0.43b | 39.05±0.46ab | 39.38±1.17ab | 40.12±0.40a | 40.43±0.96ab |
3 | 39.42±0.61b | 39.70±1.29ab | 40.30±0.77ab | 40.67±0.80a | 39.94±0.84ab |
6 | 38.91±0.87b | 40.20±1.06ab | 39.62±1.19ab | 40.33±0.63a | 40.16±1.73ab |
Moisture (%) | 1 | 60.81±0.43a | 60.95±0.45ab | 60.62±1.17ab | 5988±0.40b | 59.57±0.96ab |
3 | 60.58±0.61a | 60.30±1.29ab | 59.70±0.70ab | 59.33±0.80b | 60.06±0.84ab |
6 | 61.09±0.87a | 59.80±1.05ab | 60.38±1.19ab | 59.67±0.63b | 59.84±1.73ab |
1CTRL: control treatment; MFS: microencapsulated ferrous sulfate; FPP: ferric pyrophosphate. MFS1: 90 mg Fe/kg; MFS2: 300 mg Fe/kg; FPP1: 90 mg Fe/kg; FPP2: 300 mg Fe/kg.
Different letters on the same row represent a significant difference (p < 0.05) between treatments, as determined by the Tukey-Kramer test.
Table 2
Instrumental color of fresh cheese during storage
Color coordinate | Treatments |
Day | CTRL | MFS1 | FPP1 | MFS2 | FPP2 |
L* | 1 | 92.73±0.78 | 92.68±0.99 | 92.83±1.43 | 91.77±0.35 | 92.93±0.17 |
3 | 92.65±0.66 | 92.88±0.97 | 92.68±1.18 | 92.23±0.21 | 93.03±0.35 |
6 | 92.85±1.34 | 92.88±1.04 | 92.50±1.06 | 92.33±0.15 | 93.10±0.20 |
a* | 1 | 2.18±0.29a | 2.15±0.13a | 2.15±0.31a | 2.10±0.10a | 1.83±0.05b |
3 | 2.15±0.24a | 2.18±0.17a | 2.15±0.26a | 2.00±0.26a | 1.83±0.15b |
6 | 2.25±0.26a | 2.13±0.19a | 2.15±0.17a | 2.17±0.06a | 1.80±0.20b |
b* | 1 | 15.60±1.41 | 15.35±1.05 | 15.08±0.29 | 15.07±0.21 | 15.45±0.21 |
3 | 15.60±1.31 | 15.63±1.14 | 15.78±1.30 | 15.03±0.31 | 15.63±0.15 |
6 | 15.88±1.10 | 15.50±1.35 | 15.70±1.16 | 15.60±0.30 | 15.53±0.25 |
1CTRL: control treatment; MFS: microencapsulated ferrous sulfate; FPP: ferric pyrophosphate. MFS1: 90 mg Fe/kg; MFS2: 300 mg Fe/kg; FPP1: 90 mg Fe/kg; FPP2: 300 mg Fe/kg.
Different letters on the same row represent a significant difference (p < 0.05) between treatments, as determined by the Tukey-Kramer test.
However, the slight but significant reduction in redness in the FPP2 cheese aligns with other studies that report FPP's minimal impact on color due to its low solubility and white appearance, though at high concentrations, it can subtly improve the whiteness of the product (Beinner et al., 2010; Sousa et al., 2016). This contrasts with the findings of Santillan and Ruiz (2019), who observed an increase in the a* value of fortified yogurt, suggesting that the food matrix and specific iron form are critical factors.
3.3 Iron and calcium content
The type and concentration of the iron compound significantly influenced the mineral content (Table 3). The MFS2 treatment resulted in the highest iron content, approximately 44.5 times greater than the CTRL group. The FPP2 and MFS1 treatments had the next highest levels. Importantly, iron fortification did not negatively affect the calcium content of the cheese; in fact, the MFS2 and FPP2 treatments showed slightly higher, though not always statistically significant, average calcium levels than the CTRL group.
The significant increase in iron content confirms the successful fortification process. The absence of an impact on calcium levels aligns with the findings of Jalili et al. (2017) and Arce and Ustunol (2018). This likely occurs because iron was added during the salting stage, after the whey had been drained and the cheese matrix was essentially formed. By this point, the protein structure is solid, which reduces the chance of iron displacing the already-bound calcium.
3.4 Sensory characterization
Before sensory evaluation, all cheese samples were verified to meet the microbiological safety standards, as specified in the Peruvian technical standard. This ensures that any sensory characteristics observed are due to the fortification treatments and not microbial spoilage.
The iron fortification had a significant impact on overall liking and sensory profile (Table 4). The CTRL and FPP2 treatments received the highest scores for overall liking, with no significant difference between them. In contrast, the MFS2 treatment had the lowest acceptance score. Regarding specific attributes, the MFS2 treatment scored highest for both metallic taste and rancidity, which directly corresponds to its low overall liking score.
Table 3
Iron and calcium content of reformulated fresh cheese
Ion | Treatments |
Day | CTRL | MFS1 | FPP1 | MFS2 | FPP2 |
Fe (mg/kg) | 1 | 5.10±1.20e | 83.00±5.80c | 70.60±4.40d | 224.50±8.20a | 187.50±12.70b |
3 | 5.00±0.90e | 83.30±5.80c | 70.80±4.50d | 223.50±9.20a | 186.30±9.20b |
6 | 5.10±1.40e | 83.60±4.50c | 71.40±4.90d | 225.70±7.00a | 184.90±13.30b |
Ca (mg/kg) | 1 | 505.50±50.4b | 516.40±47.40b | 554.40±69.20ab | 609.80±25.20a | 583.80±29.50ab |
3 | 496.20±48.8b | 514.40±43.90b | 560.10±71.00ab | 606.50±41.50a | 573.80±29.40ab |
6 | 501.80±40.2b | 509.00±44.70b | 559.60±68.40ab | 612.40±39.70a | 567.00±30.10ab |
1CTRL: control treatment; MFS: microencapsulated ferrous sulfate; FPP: ferric pyrophosphate. MFS1: 90 mg Fe/kg; MFS2: 300 mg Fe/kg; FPP1: 90 mg Fe/kg; FPP2: 300 mg Fe/kg.
Different letters on the same row represent a significant difference (p < 0.05) between treatments, as determined by the Tukey-Kramer test.
Table 4
Sensory characteristics of reformulated fresh cheese
Overall liking and sensory attributes | Treatments |
CTRL | MFS1 | FPP1 | MFS2 | FPP2 |
Overall liking | 6.58±1.82a | 5.28±2.13bc | 6.34±2.04ba | 4.31±2.12c | 6.52±1.77a |
Whiteness | 2.25±2.00 | 2.67±2.23 | 2.4±2.16 | 3.07±2.34 | 3.02±2.24 |
Appearance uniformity | 6.33±2.69ba | 6.28±2.41ba | 6.87±2.64a | 5.39±2.70b | 6.69±2.27a |
Firmness | 5.68±2.55 | 6.16±2.28 | 6.51±2.59 | 5.56±2.77 | 5.87±2.48 |
Saltiness | 2.06±1.57 | 2.05±1.63 | 2.08±1.71 | 1.99±1.80 | 2.21±1.68 |
Acidity | 1.02±1.14 | 1.42±1.72 | 1.29±1.44 | 1.36±1.67 | 1.32±1.48 |
Bitterness | 0.93±1.28 | 1.46±1.67 | 1.16±1.35 | 1.76±1.98 | 1.32±1.49 |
Metallic taste | 1.09±1.38c | 2.27±2.33b | 1.29±1.71bc | 3.72±2.82a | 1.54±1.76bc |
Rancidity | 1.29±1.68c | 2.56±2.52ab | 1.54±2.02bc | 3.46±2.88a | 1.78±2.17bc |
Moisture release in mouth | 2.48±2.26 | 2.68±2.26 | 2.27±2.14 | 2.76±2.22 | 2.72±2.41 |
1CTRL: control treatment; MFS: microencapsulated ferrous sulfate; FPP: ferric pyrophosphate. MFS1: 90 mg Fe/kg; MFS2: 300 mg Fe/kg; FPP1: 90 mg Fe/kg; FPP2: 300 mg Fe/kg.
Different letters on the same row represent a significant difference (p < 0.05) between treatments, as determined by the Tukey-Kramer test.
Dimension 1, which accounted for 66.00% of the variance, clearly acted as a sensory quality axis, creating a distinct separation between treatments based on their desirability (Figure 1). On the left side of the biplot, the CTRL and FPP treatments were strongly associated with the "overall liking" vector and positive attributes, such as "uniform appearance" and "firmness." The univariate data support this, showing that CTRL (6.58) and FPP2 (6.52) received the highest and statistically similar overall liking scores. This indicates that FPP, even at high concentrations, effectively preserves the sensory profile of the cheese, making it a highly suitable fortificant.
Conversely, the right side of the biplot was defined by negative attributes, or sensory defects. The MFS treatments were positioned here, indicating a significant sensory trade-off for their use. The MFS2 treatment was distinctly isolated on the far right, showing a strong positive correlation with the "Rancidity" and "Metallic taste" vectors.
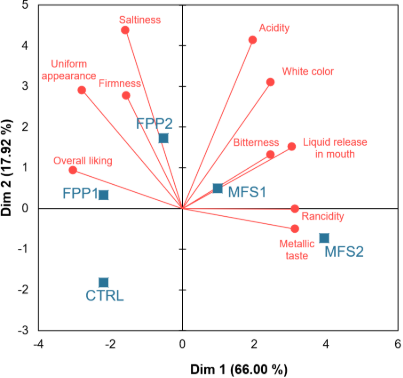
Figure 1. Principal component analysis of sensory characteristics of fresh cheese according to treatment of iron fortification. CTRL: control treatment; MFS: microencapsulated ferrous sulfate; FPP: ferric pyrophosphate. MFS1: 90 mg Fe/kg; MFS2: 300 mg Fe/kg; FPP1: 90 mg Fe/kg; FPP2: 300 mg Fe/kg.
This multivariate position is quantitatively confir-med by the univariate data, where MFS2 scored the highest for both rancidity (3.46) and metallic taste (3.72), and consequently, received the lowest overall liking score (4.31). The MFS1 treatment occupied an intermediate position, associated with "Bitterness" and "Acidity," suggesting that even at a lower dose, MFS introduces noticeable off-flavors. This integrated view demonstrates a clear dose-dependent negative effect of MFS. While MFS fortification was effective from a nutritional standpoint (as shown in the mineral analysis), it failed to adequately mask the pro-oxidative and metallic characteristics of ferrous sulfate, resulting in a product with low consumer liking. The FPP, due to its lower reactivity and insolubility, avoided these defects. Therefore, the multivariate analysis not only confirms the univariate findings but also illustrates a sensory conflict: the most effective treatment for iron enrichment (MFS2) was the least liked by consumers. This highlights that for the successful fortification of sensorially delicate products, such as fresh cheese, the chemical stability of the fortificant is more critical than simply the delivered dose.
4. Conclusions
This study demonstrates that FPP is a significantly more suitable fortificant for fresh cheese than microencapsulated ferrous sulfate MFS. While both compounds successfully increased the iron content without negatively affecting calcium levels, their impact on sensory quality was markedly different. The MFS treatments, particu-larly at 300 mg/kg concentration, induced strong metallic and rancid off-flavors, which drastically reduced consumer liking. In contrast, FPP preserved the sensory profile, maintaining an overall liking statistically similar to the control cheese and even slightly improving the visual appearance by reducing redness (a* value). Therefore, FPP is the recommended iron source for developing sensorially acceptable fortified fresh cheese.
Future research should focus on quantifying lipid oxidation and establishing the shelf life to further validate the stability of FPP-fortified products.
Acknowledgments
This research was supported by the project "Efecto de la adición de sulfato ferroso microencapsulado sobre las características fisicoquímicas y sensoriales de queso fresco," funded by Resolución de Comisión Organizadora No. 0835-2019-UNAM, as modified by Resolución de Facultad N.° 0069-2025-D-FACIA-UNAM.
References
Allen, E. L., de Benoist, B., Dary, O., & Hurrell, R. (2006). Guidelines on food fortification with micronutrients. World Health Organization.
American Public Health Association (APHA). (2001). Compendium of methods for the microbiological examination of foods (4th ed.). APHA Press, Washington, D.C.
Arce, A., & Ustunol, Z. (2018). Effect of microencapsulated ferrous sulfate particle size on Cheddar cheese composition and quality. Journal of Dairy Science, 101(8), 6814–6822. https://doi.org/10.3168/jds.2017-13952
Beinner, M. A., Soares, A. D. N., Barros, A. L. A., & Monteiro, M. A. M. (2010). Sensory evaluation of rice fortified with iron. Ciência e Tecnologia de Alimentos, 30(2), 516–519. https://doi.org/10.1590/S0101-20612010000200034
Boccio, J., & Monteiro, J. B. (2004). Fortificación de alimentos con hierro y zinc: Pros y contras desde un punto de vista alimenticio y nutricional. Revista de Nutrição, 17, 71–78. https://doi.org/10.1590/S1415-52732004000100008
Chang, Y. H., Lee, S. Y., & Kwak, H.-S. (2016). Physicochemical and sensory properties of milk fortified with iron microcapsules prepared with water-in-oil-in-water emulsion during storage. International Journal of Dairy Technology, 69(3), 452–459. https://doi.org/10.1111/1471-0307.12282
Cortéz, J. D., Leurino, L., Rodríguez, M. S., Bejarano, B., Cuffia, F., & Rozycki, S. D. (2023). Influencia del tipo de fortificante férrico sobre los atributos fisicoquímicos, sensoriales y aceptabilidad de pastas lácteas untables a partir de lactosuero. En Herramientas para Implementar Economías Circulares en Procesos Agroindustriales: Parte 2. Asociación Universitaria Iberoamericana de Posgrado. https://ri.conicet.gov.ar/handle/11336/246224
Da Silva, N., Junqueira, V. C. A., & Silveira, N. F. A. (2021). Manual de métodos de análise microbiológica de alimentos e água. Blucher. https://doi.org/10.5151/9786555062977
Dehnad, D., Ghorani, B., Emadzadeh, B., Emadzadeh, M., Assadpour, E., Rajabzadeh, G., & Jafari, S. M. (2024). Recent advances in iron encapsulation and its application in food fortification. Critical Reviews in Food Science and Nutrition, 64(33), 12685–12701. https://doi.org/10.1080/10408398.2023.2256004
Gaucheron, F. (2000). Iron fortification in dairy industry. Trends in Food Science & Technology, 11(11), 403–409. https://doi.org/10.1016/S0924-2244(01)00032-2
Hurrell, R. F. (2009). Preventing iron deficiency through food fortification. Nutrition Reviews, 55(6), 210-222. https://doi.org/10.1111/j.1753-4887.1997.tb01608.x
Instituto Nacional de Estadística e Informática (INEI). (2024). El 43,1% de la población de 6 a 35 meses de edad sufrió de anemia en el año 2023 [Informe]. INEI.
International Nutritional Anemia Consultative Group (INACG). (2021). Technical brief on iron compounds for fortification of staple foods. Food Systems.
International Organization for Standardization. (2004). ISO 5534:2004 – Cheese and processed cheese — Determination of the total solids content (Reference method). ISO.
Jalili, M., Ehsani, M. R., & Mazloumi, M. T. (2017). Evaluation of iron-fortified Feta cheese for physicochemical and sensory properties. International Journal of Dairy Technology, 70(4), 526–532. https://doi.org/10.1111/1471-0307.12378
Mallqui Salas, S. S. (2021). Impacto de la suplementación de hierro y/o fortificación de alimentos con hierro [Tesis de licenciatura, Universidad Peruana Cayetano Heredia]. Repositorio UPCH.
Ministerio de Salud del Perú. (2008). Norma Sanitaria que establece los criterios microbiológicos de calidad sanitaria e inocuidad para los alimentos y bebidas de consumo humano (NTS Nº 071-MINSA/DIGESA-V.01). Dirección General de Salud Ambiental.
Morales, J. C., Sánchez-Vargas, E., García-Zepeda, R., & Villalpando, S. (2015). Evaluación sensorial de suplementos lácteos enriquecidos con hierro reducido, sulfato ferroso o fumarato ferroso. Salud Pública de México, 57(1), 14–21.
Muñoz-More, H. D., Nole-Jaramillo, J. M., Valdiviezo-Marcelo, J., Espinoza-Delgado, M. del P., Socola-Juarez, Z. M., Ruiz-Flores, L. A., & Espinoza-Espinoza, L. A. (2023). Microencapsulated iron in food, techniques, coating material, efficiency, and sensory analysis: A review. Frontiers in Sustainable Food Systems, 7, 1146873. https://doi.org/10.3389/fsufs.2023.1146873
Nabeshima, E. H., Ormenese, R. de C. S. C., Montenegro, F. M., Toda, E., & Sadahira, M. S. (2005). Propriedades tecnológicas e sensoriais de pães fortificados com ferro. Food Science and Technology, 25, 506-511. https://doi.org/10.1590/S0101-20612005000300019
Quicaño Huaman, M., & Moreno Casavilca, J. C. (2023). Microencapsulación de la sangre bovina por el método de gelificación iónica y su aplicación en la fortificación de queso fresco. Repositorio Institucional UNSCH.
Saldaña, E., Rios-Mera, J., Arteaga, H., Saldaña, J., Samán, C. M., Selani, M. M., & Villanueva, N. D. M. (2018). How does starch affect the sensory characteristics of mazamorra morada? A study with a dessert widely consumed by Peruvians. International Journal of Gastronomy and Food Science, 12, 22-30. https://doi.org/10.1016/j.ijgfs.2018.01.002
Santillan, E., & Ruiz, J. F. V. (2019). Evaluación de propiedades fisicoquímicas y físicas de dos alimentos lácteos (yogur y queso) enriquecidos con nanopartículas de Ca, Fe y Zn. Revista Colombiana de Investigaciones Agroindustriales, 6(1), 1. https://doi.org/10.23850/24220582.1606
Siddique, A., & Park, Y. W. (2019). Effect of iron fortification on microstructural, textural, and sensory characteristics of caprine milk Cheddar cheeses under different storage treatments. Journal of Dairy Science, 102(4), 2890-2902. https://doi.org/10.3168/jds.2018-15427
Smialowska, M. (2017). The role of phosphoserine residues in the structure and interactions of milk proteins – a review. Polish Journal of Food and Nutrition Sciences, 67(3), 169-180. https://doi.org/10.1515/pjfns-2016-0030
Sousa, C. D. S., De Macedo Fernandes, B. C. T., & Fernandes, P. H. S. (2016). Caracterização de bebida láctea pasteurizada com adição de ferro. Revista Eletrônica TECCEN, 8(1), 27. https://doi.org/10.21727/teccen.v8i1.227
Vargas-Uscategui, A., Londoño-Londoño, J., & Rendón, M. (2017). Physicochemical and sensory characterization of Paipa cheese. Revista de la Facultad de Química Farmacéutica, 24(1), 59-70.
Villanueva, N. D. M., & Da Silva, M. A. A. P. (2009). Comparative performance of the nine-point hedonic, hybrid and self-adjusting scales in the generation of internal preference maps. Food Quality and Preference, 20(1), 1-12. https://doi.org/10.1016/j.foodqual.2008.06.003
Villaquirán, Z., Burbano, P., Osorio-Mora, O., Cerón-Cardenas, A. F., & Bucheli-Jurado, M. A. (2017). Diseño de un alimento infantil listo para consumir fortificado con hierro a base de arveja (Pisum sativum). Universidad y Salud, 20(1), 4. https://doi.org/10.22267/rus.182001.104
World Health Organization (WHO). (2023). Anemia. https://www.who.int/es/news-room/fact-sheets/detail/anaemia
Xu, Y., Yan, X., Zheng, H., Li, J., Wu, X., Xu, J., Zhen, Z., & Du, C. (2024). The application of encapsulation technology in the food industry: Classifications, recent advances, and perspectives. Food Chemistry: X, 21, 101240. https://doi.org/10.1016/j.fochx.2024.101240